REDHUNT LABS
DISCOVER. ATTACK .REPEAT
NVADR Documentation
This documentation will give you a detailed understanding of the features of NVADR and illustrate the various third party integrations that come along with it.
NVADR - V.1.01/22
Overview
NVADR is a SAAS-based ASM platform that allows users to continuously discover and track their attack surfaces.
The platform continuously tracks and discover assets related to your organization and identify security
risks/exposures before attackers do. This is achieved by using the billions of asset-owner relationships
created by hundreds of our bots deployed across the internet.
NVADR is a combination of six modules that provide a complete attack management solution. Each module is provided with an array of features. This document will give you a detailed understanding about the NVADR, also covers the actions that can be performed in the platform.
Table of Contents
Terminology
| TERM | DEFINITION |
|---|---|
| Asset | Whenever we refer to the term assets in NVADR that implies digital (software-defined) assets. Assets are operational entities - Domains, IP address, Docker containers, cloud keys, associated buckets, and more |
| Tags/Asset Tags | Tags provide information about certain data/item/responses related to an asset. |
| Possible Risks | The vulnerabilities in the discovered attack surfaces. Ex: security misconfiguration, outdated systems, etc. |
| First Seen | The scan date at which the asset was first discovered. |
| Last Seen | The scan date at which the asset was last seen. |
| Ports | It is a logical construct (specific numbers) that are reserved to identify a particular process or service (assets). |
| Severity | NVADR identifies the severity of a discovered security risk instance. Based on the severity the instances can be filtered. |
Dashboard
The first paragraph text
Attack Surface
Attack surfaces are the digital assets of an organization, accessible through the internet. With
the evolution in technology, the extent of an organization's assets has also increased, thus
increasing the attack surfaces. The first step in protecting attack surfaces is to identify them.
NVADR's attack surface module discovers all the assets of an organization and lists them based on
the pre-defined asset types. The asset types are decided based on the most common assets that
can be discovered.
The attack surface module is further divided into:
Asset Exposure
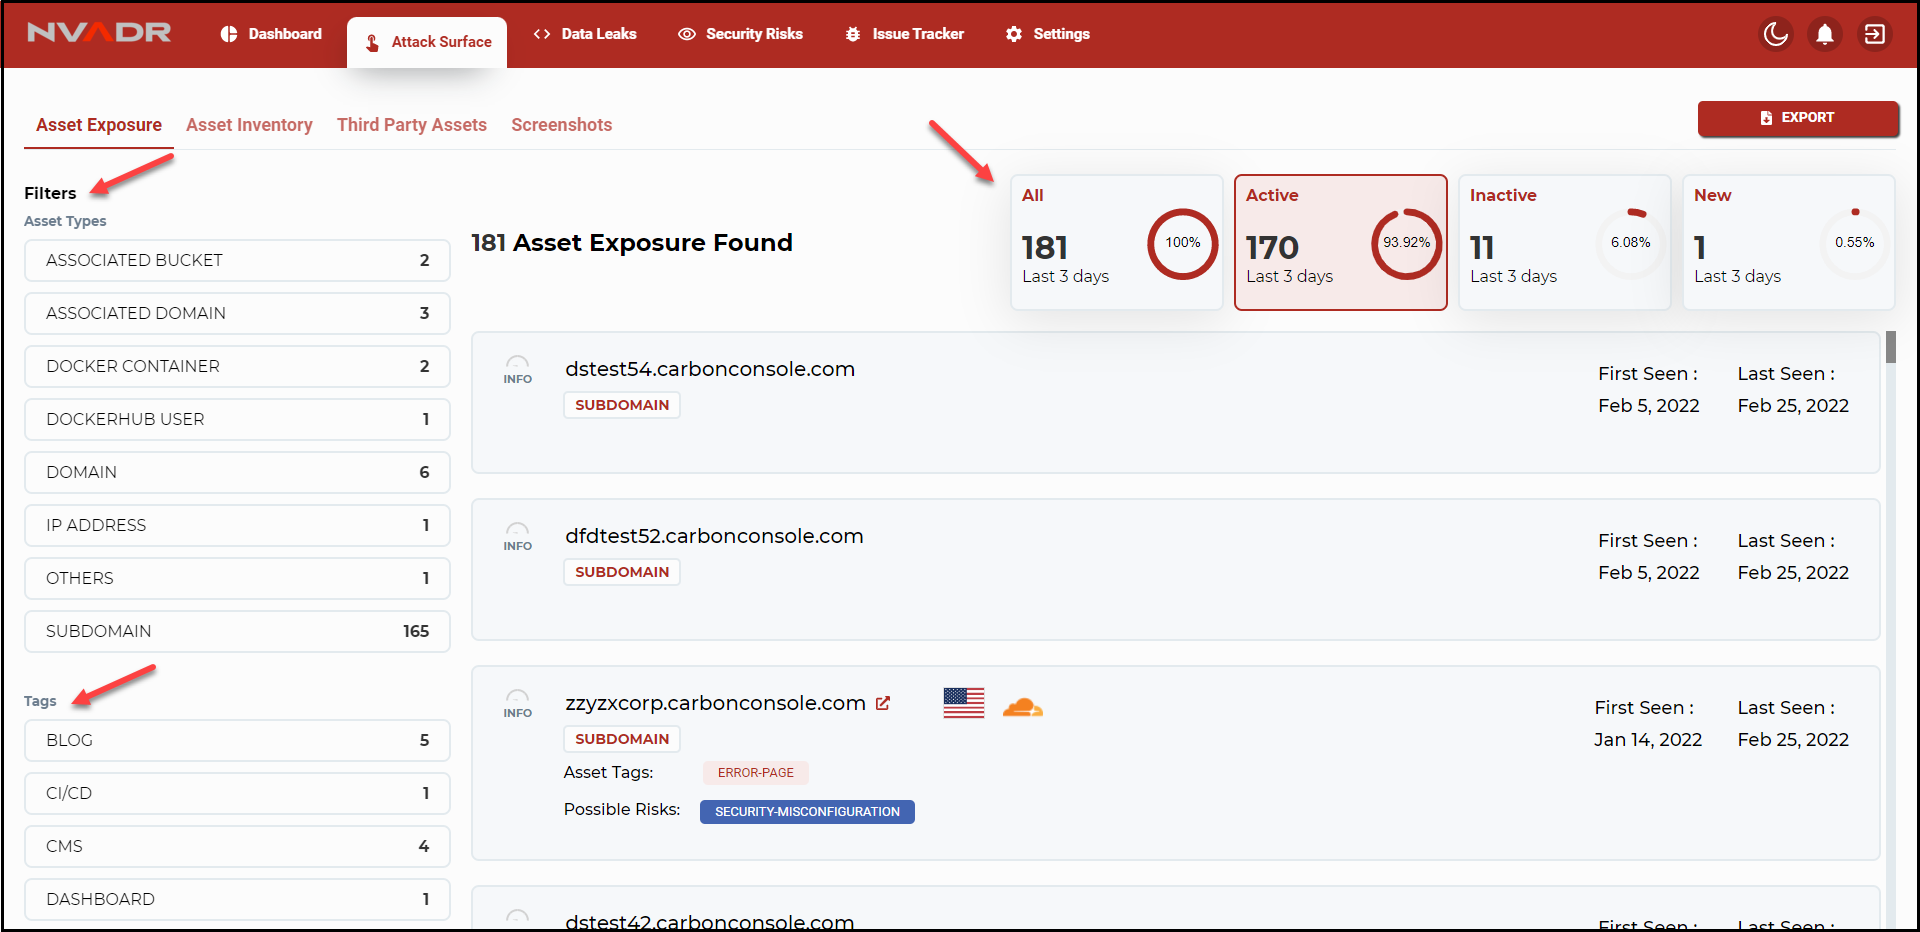
- Under asset exposure you can view all the discovered assets in a list format. Each asset
is displayed with the URL, asset type, asset tag, possible risks, cloud classification,
first seen and last seen dates. - The number of discovered assets can be large. To scroll through the long list is time-consuming.
For a simplified approach to data, the assets can be filtered based on asset types, tags, and scan
status. Actions:
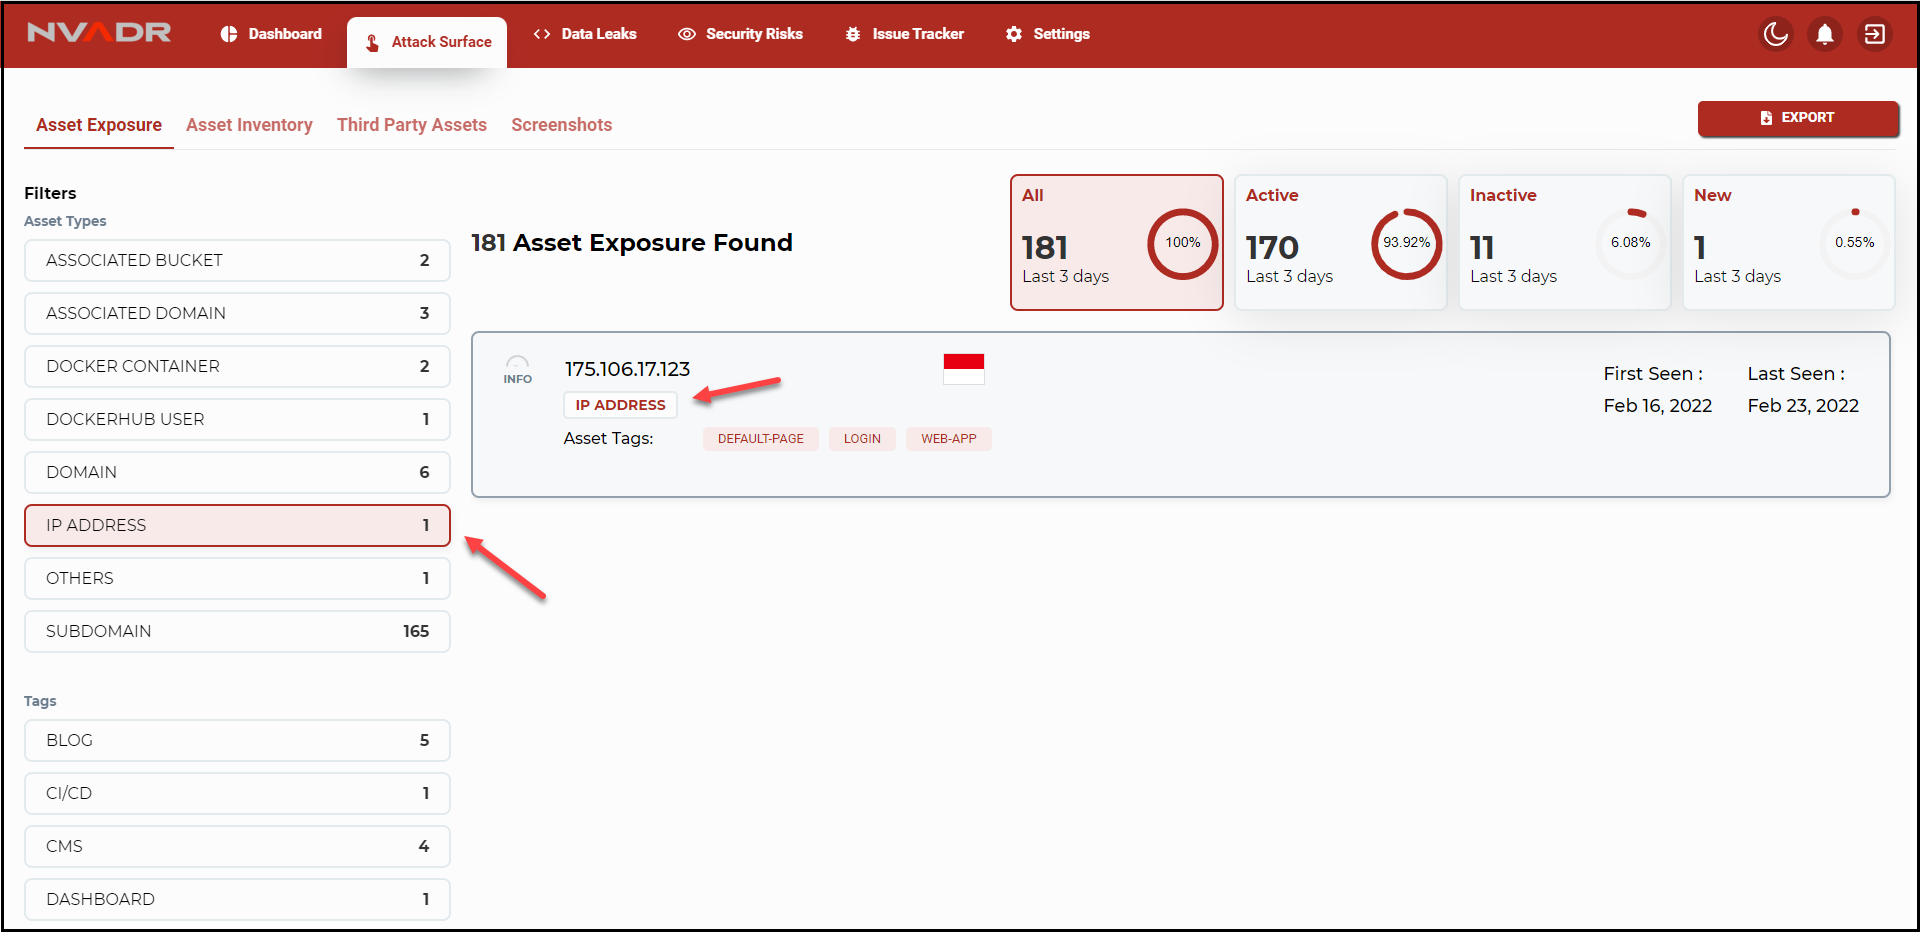
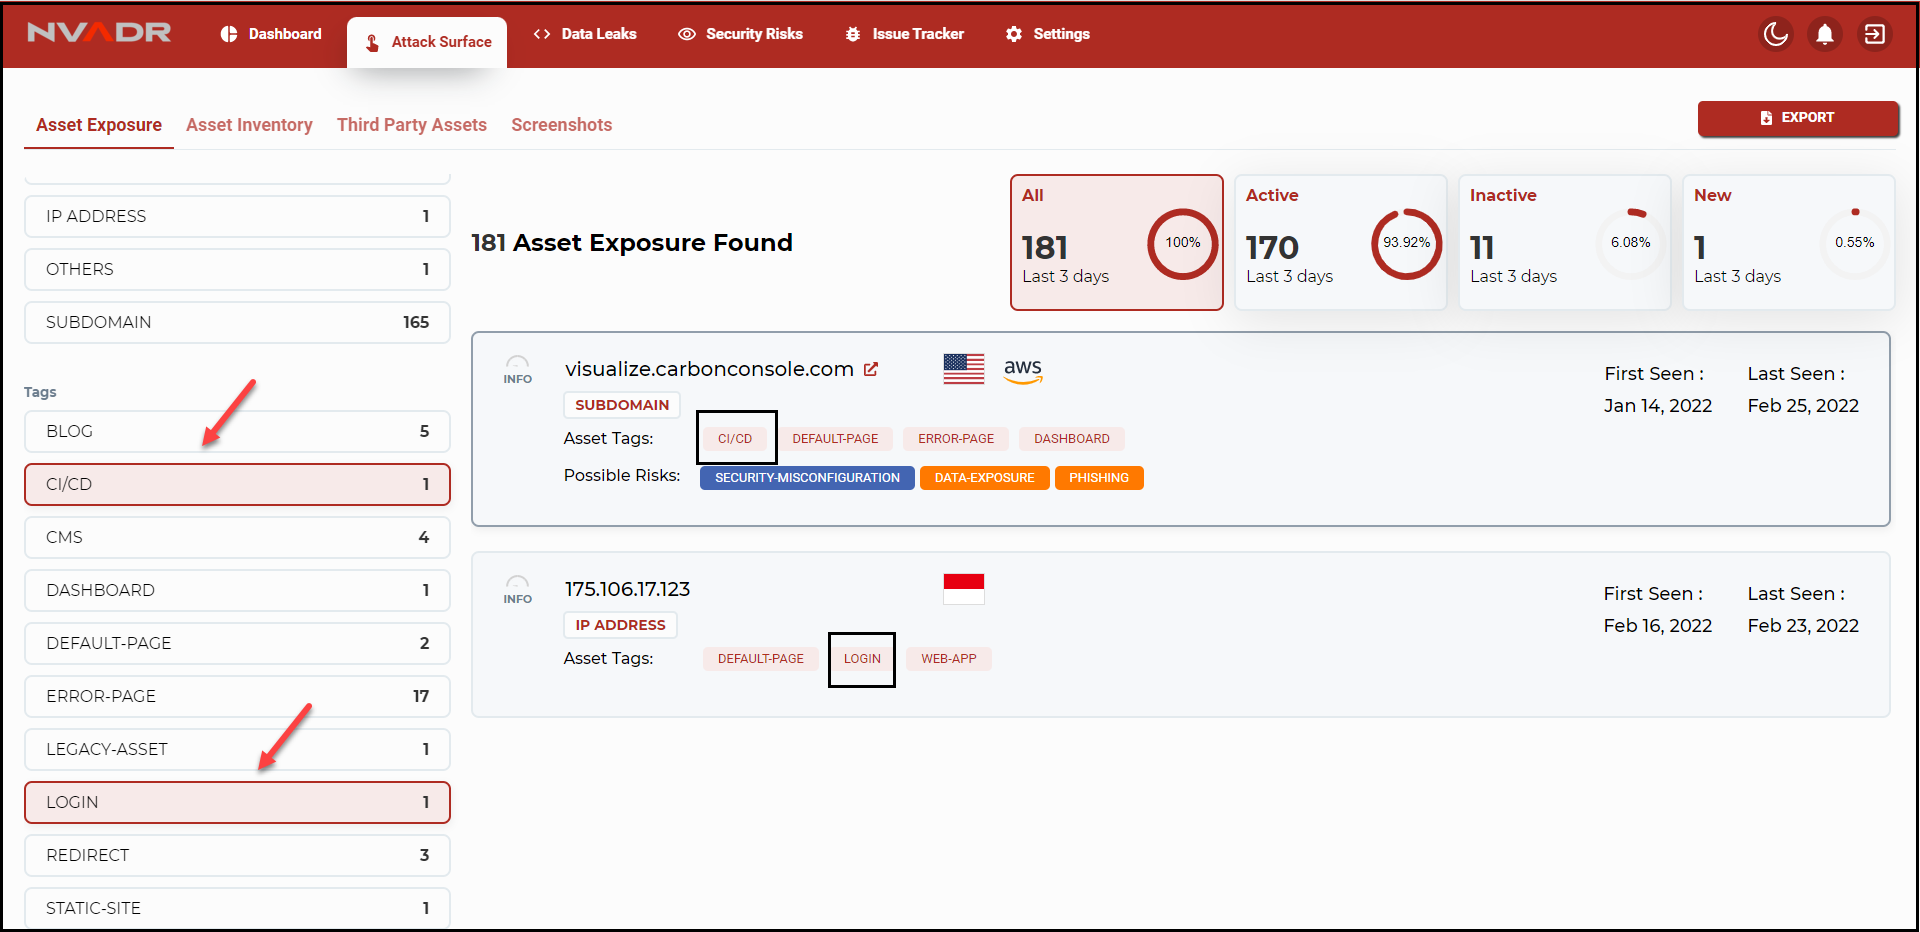
- The assets can be filtered based on asset types and tags. Click on the asset type/tag for
which you wish to view the data.
- The assets can be filtered based on asset types and tags. Click on the asset type/tag for
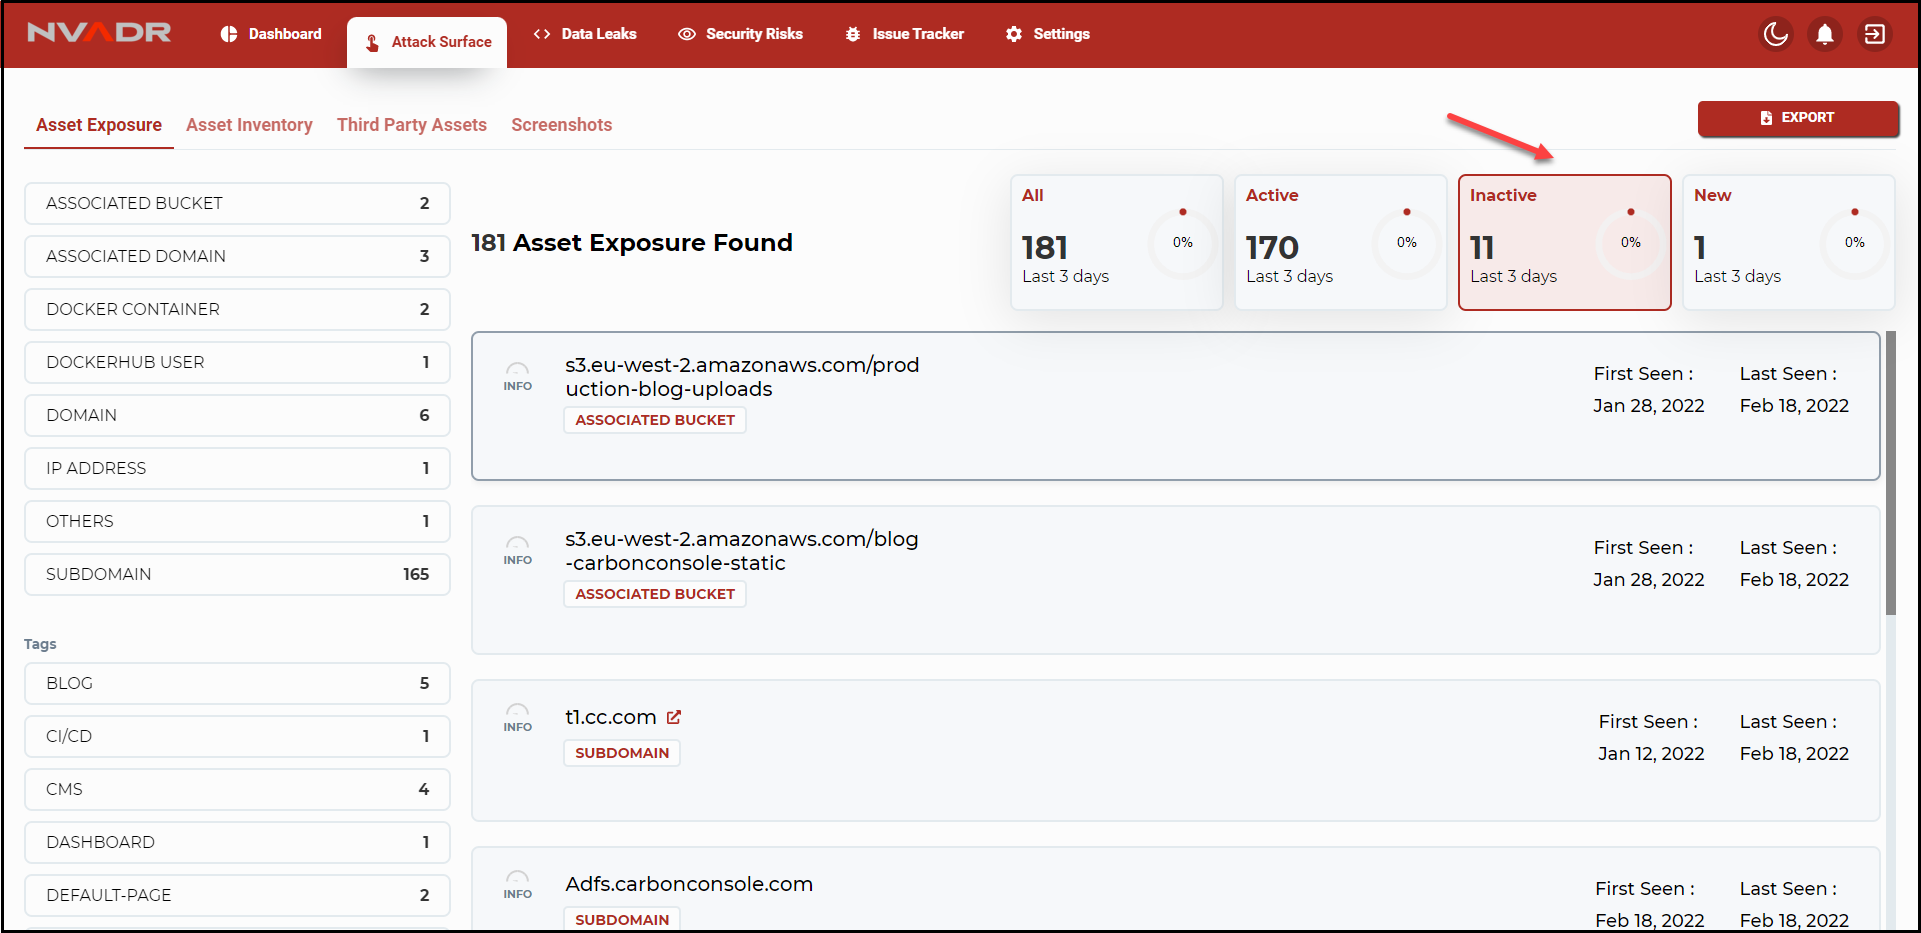
- Another way to filter the assets is based on the scan status, these are the following filters:
- All: The total number of assets discovered in all the scans. All is the sum of active, inactive, and new filters.
- Active: The total number of active assets (the assets that are still accessible over the internet) discovered since the last scan.
- Inactive: The total number of inactive assets (the ones discovered in the previous scans but not in
the latest scans) have been discovered since the last scan. - New: NVADR is a platform that performs continuous analysis to discover new assets. The new filter will list the most
recently discovered assets.
Asset Inventory
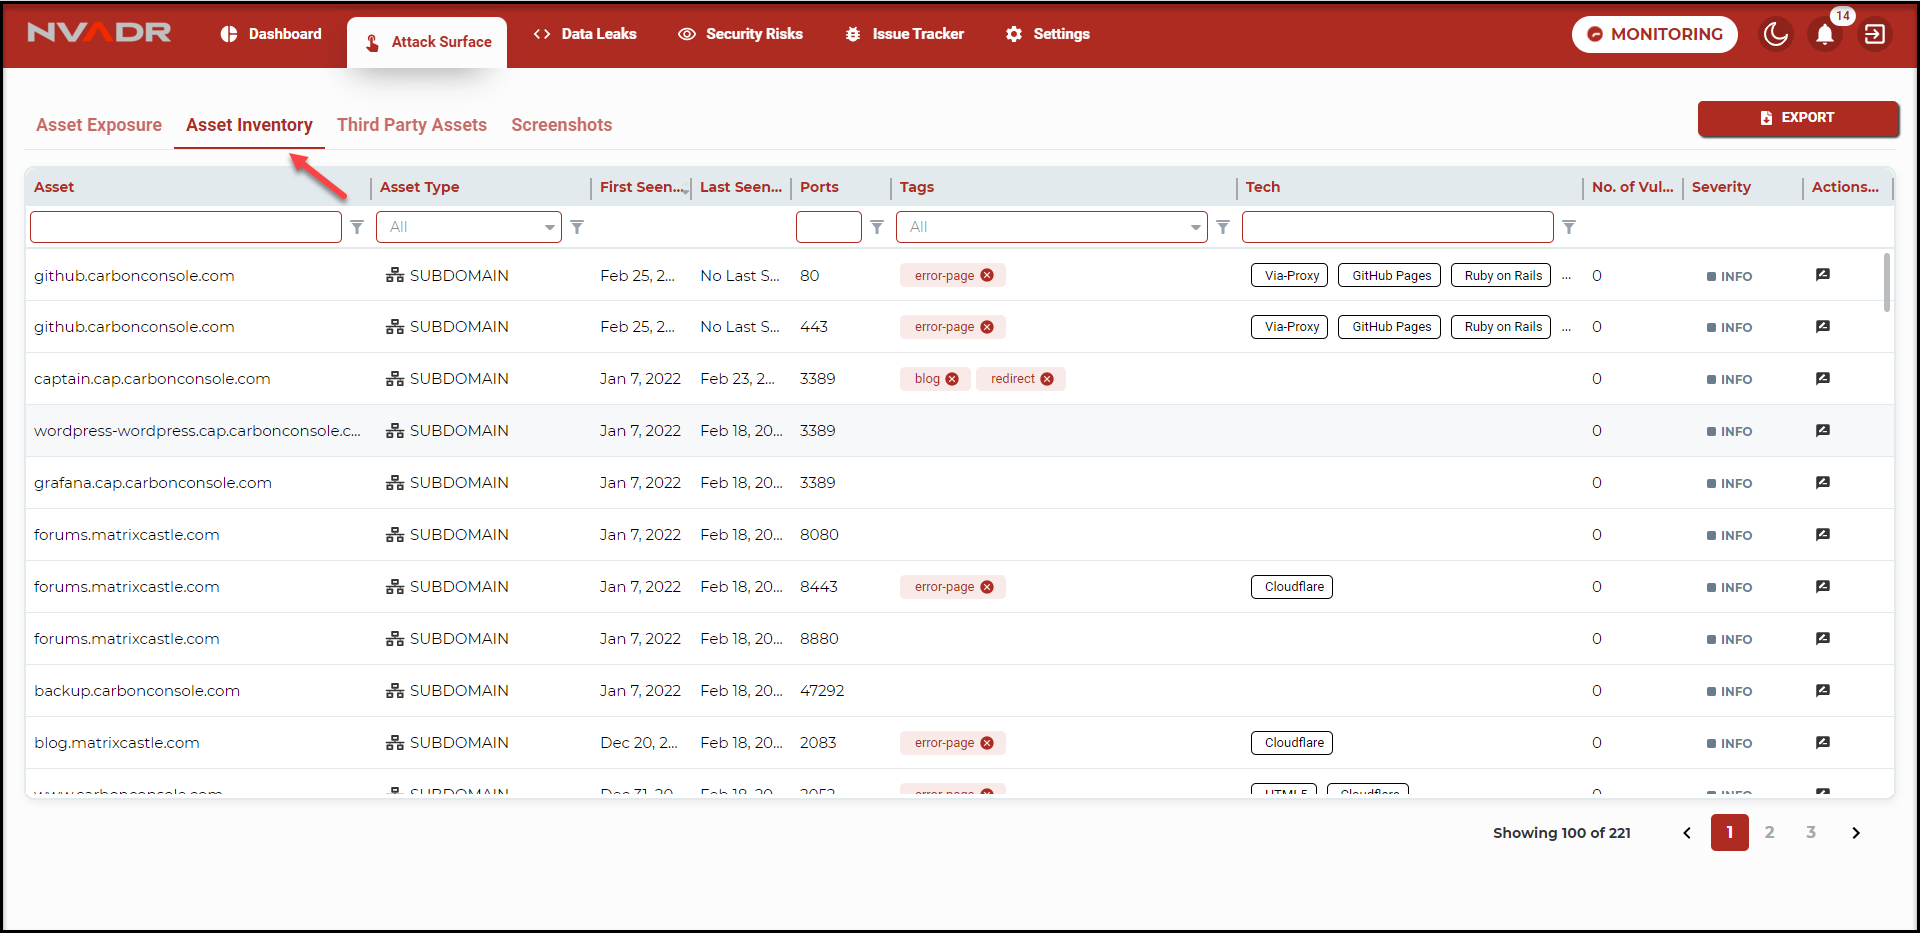
- Under asset inventory you can view all the discovered assets in a column and row format.
- Each asset is displayed with the asset type, ports, tags, tech (the technology that is used
in building the asset), number of vulnerabilities, severity, first seen, and last seen dates. - The data displayed in the asset inventory can be filtered based on the asset name(URL), asset type, ports, tags and tech.
Actions:
- To filter the data based on asset or ports or tech, simply enter the asset name/port number/technology in the field provided.
- To filter the data based on asset types or tags, select the required option from the provided drop-down.
- Under asset inventory, you can add tags to any selected assets. Go to actions, enter
the tag name and click on add. This way you can add your own tags.
Third-Party Assets
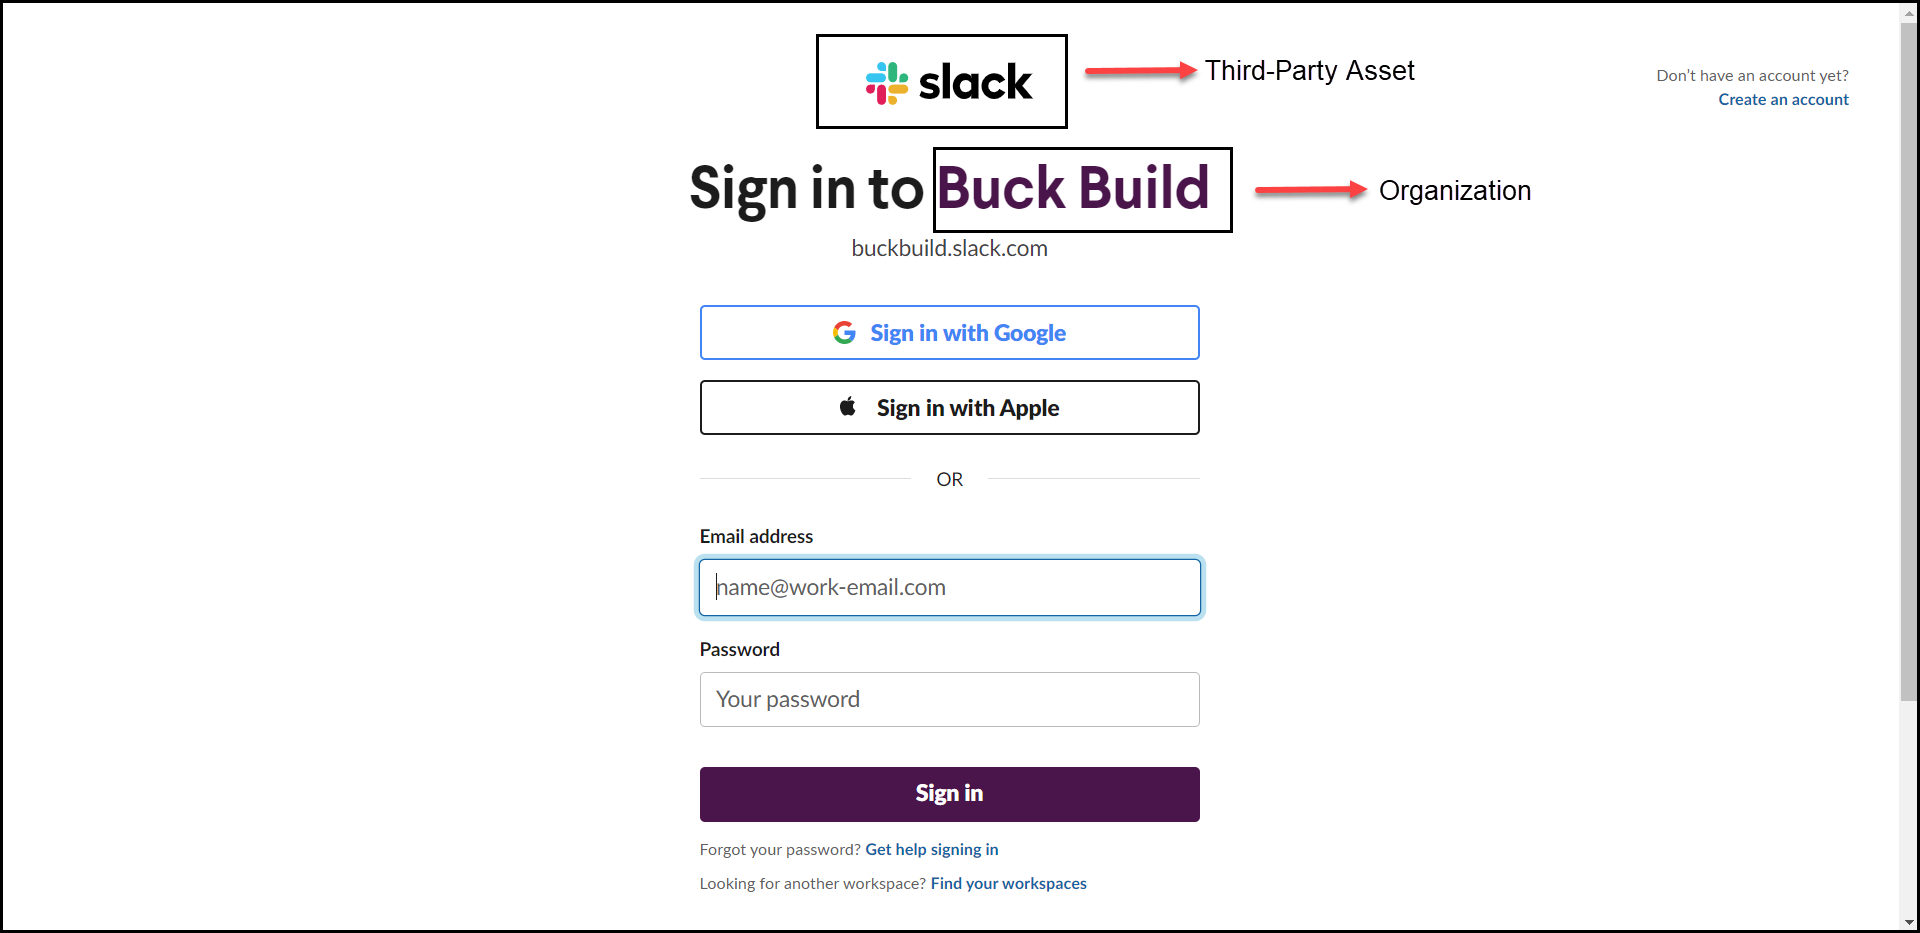
Third-party assets are services or tools of an organization used by another organization
with or without a contract. We can also define it as assets of an organization that is
owned by a third-party vendor.
Cloud-based software services, cloud web hosting services, project management tools.
CRM tools, communication tools, etc are a few examples of third-party assets.
Identifying an organization's own assets itself is a tedious task, so it can be quite challenging
to discover third-party assets. NVADR discovers all the attack surfaces that your organization is
connected to and lists then under this module.
- All the discovered third-party assets are displayed under this module.
- The third-party assets screen includes the following information:
- Asset URL and platform used.
- First Seen - Date
- Last Seen - Date
Screenshots
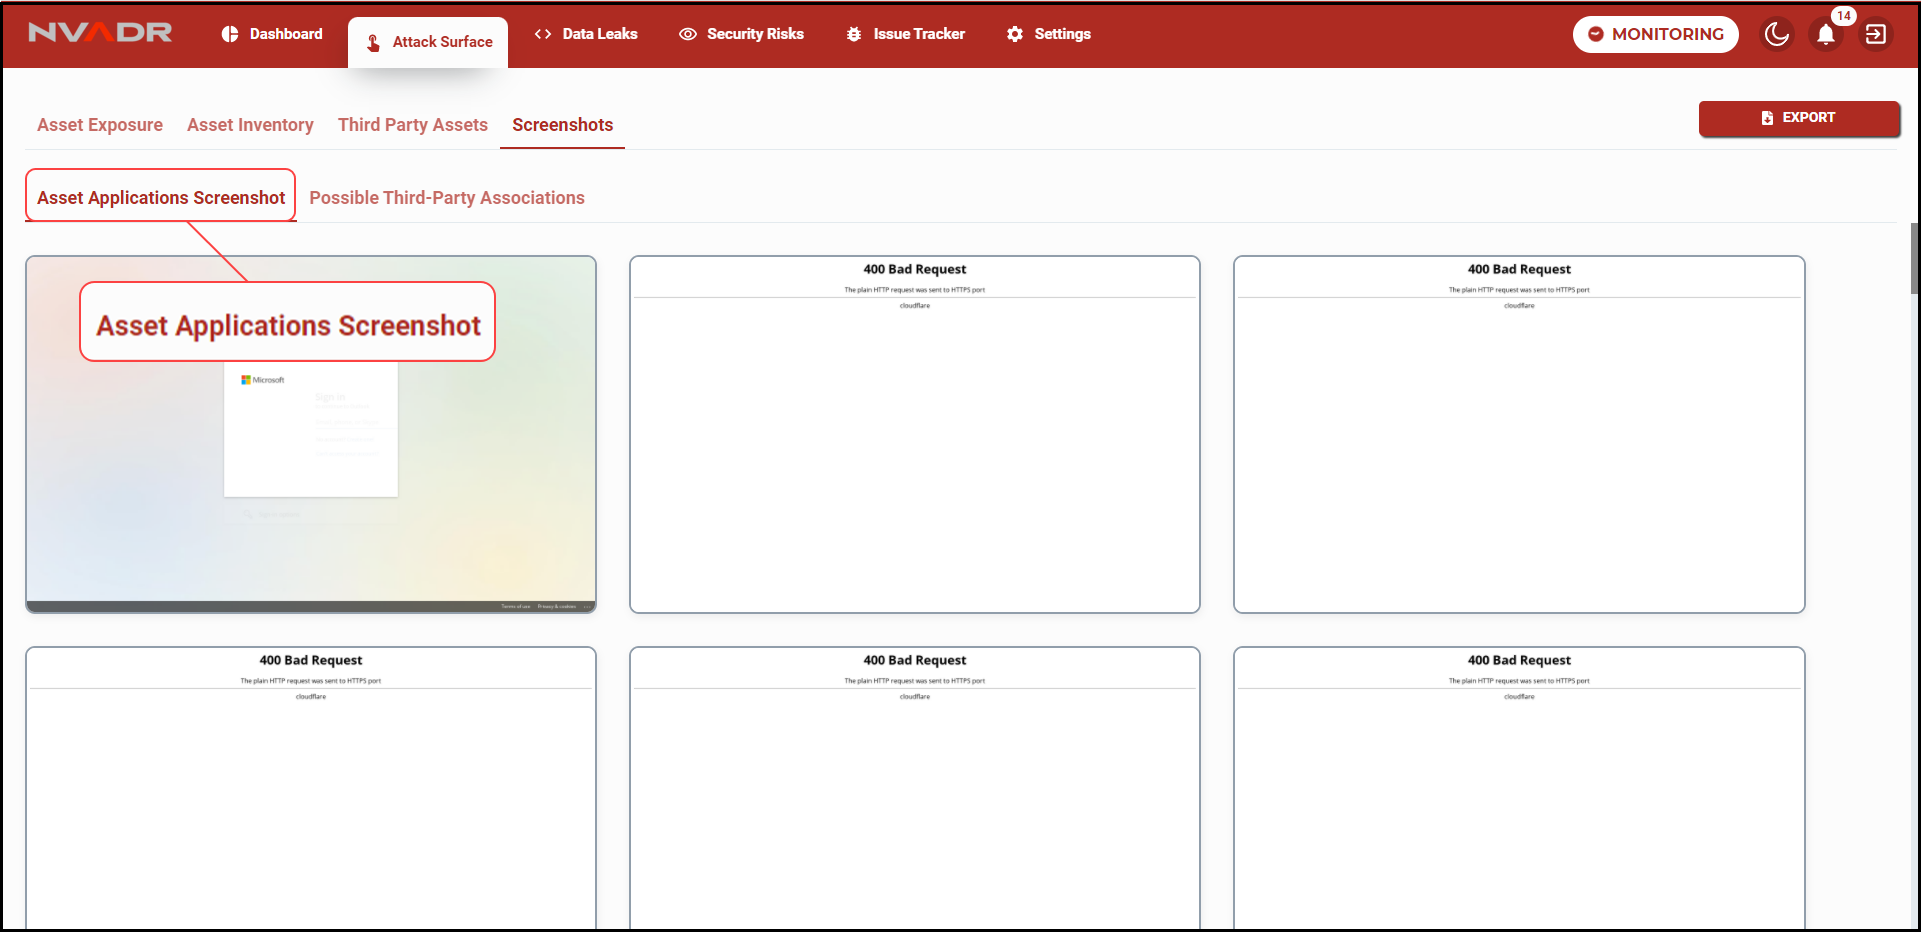
Screenshots are images of unexpected responses/contents from different ports of the
discovered assets. The screenshot module include two tabs asset application screenshots
and possible third-party associations.
Asset application screenshots include the screen responses of the assets belonging to the
organization.
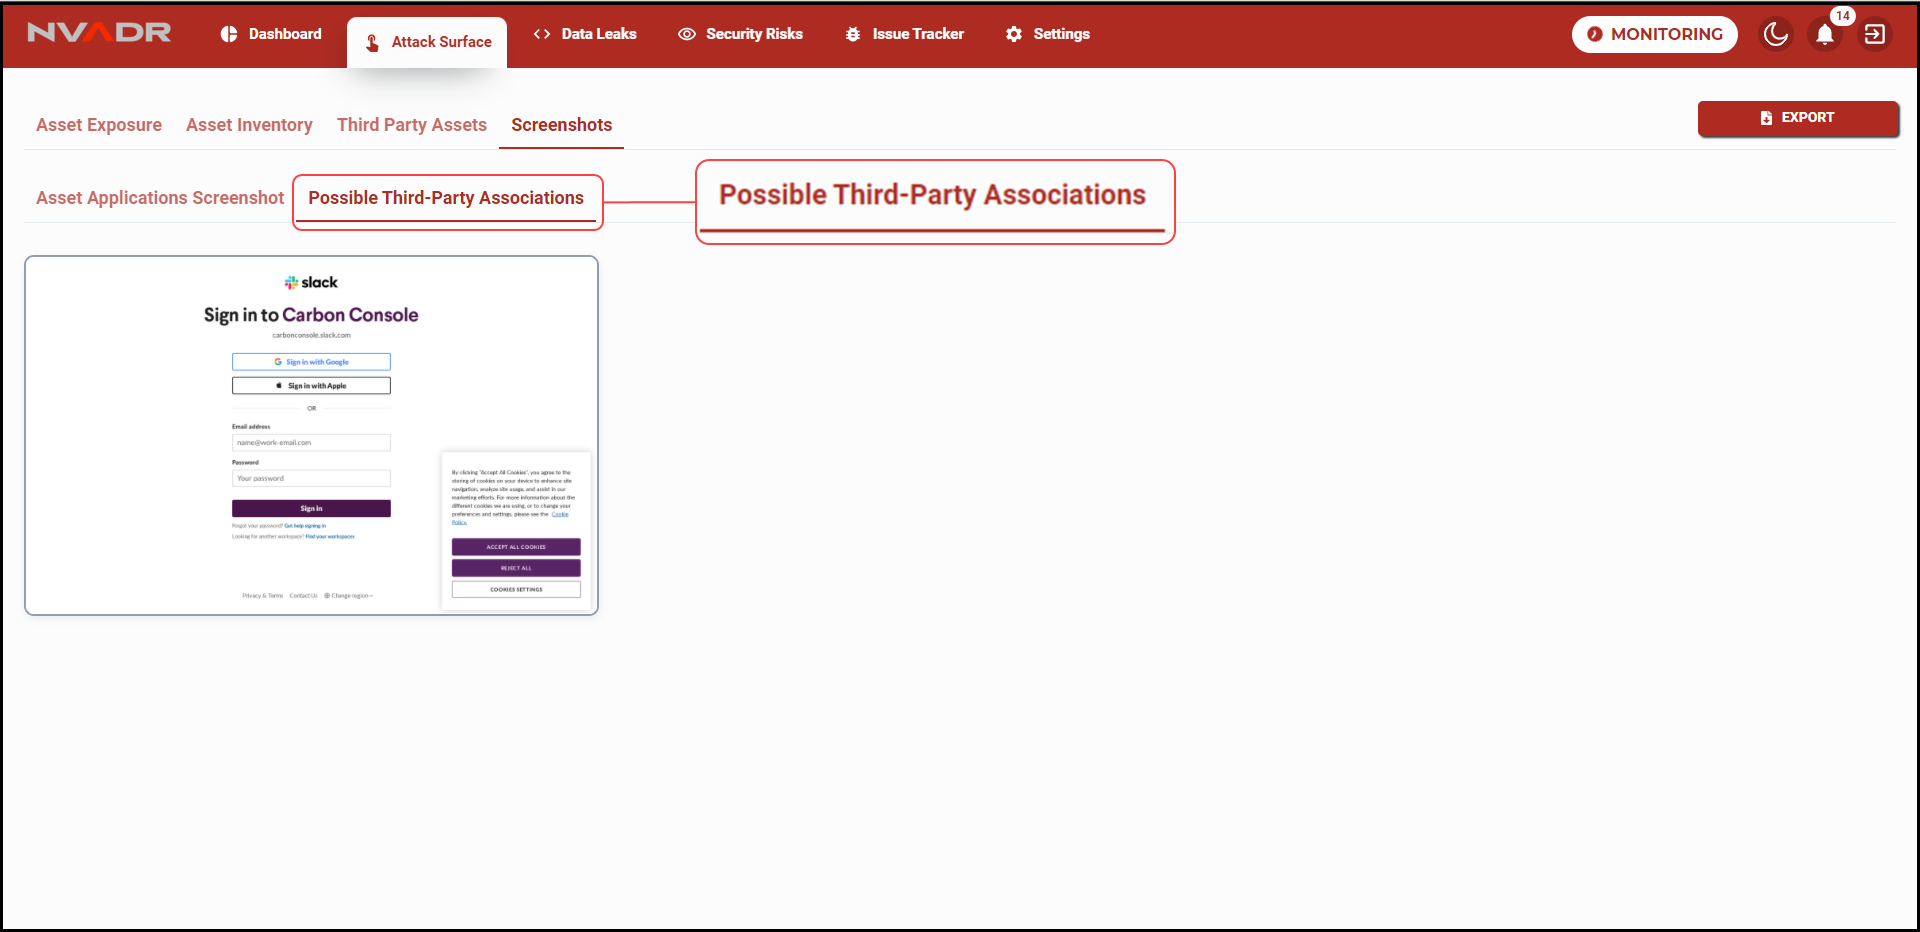
Possible third-party associations are the screen images of the discovered third-party assets.
Data Leaks
Data leaks are unintentional information disclosure. When sensitive data is accidentally
exposed on the internet or any other third-party platform it is considered a data leak.
The main cause of data leaks is poor data security practices. It is crucial to detect and
resolve data leaks before they are discovered by any unauthorized user. Data leaks also
increase the risk of data breaches.
NVADR’s data leak detection feature looks throughout the organization’s network and identifies
all the data leaks. With continuous scans and identification of data exposure, this feature
helps in improving an organization’s data security.
NVADR has a set of pre-defined filters to identify and list the most commonly occurring data leaks.
The pre-defined filters fasten the process.
List Layout
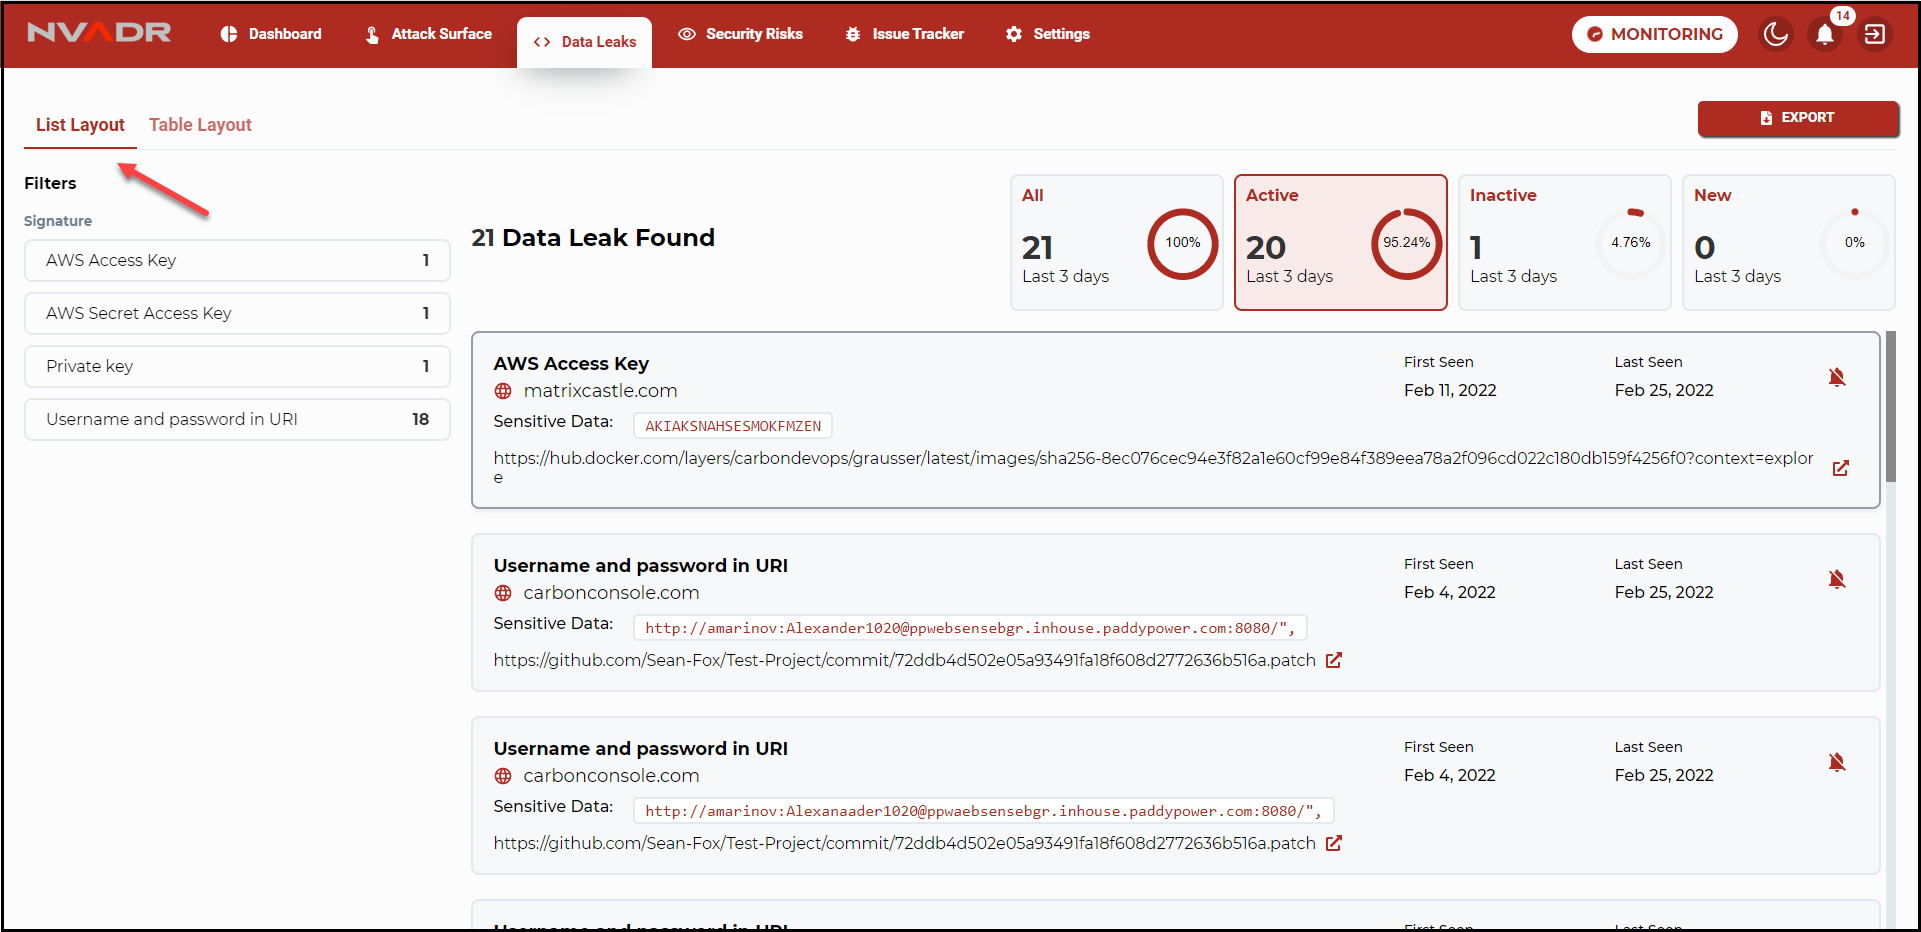
- The list layout displays the data in list format with filters provided at the left side (Signature filters)
and top right corner (Scan status filters) of the screen.
Actions
- The data leaks can be filtered based on the pre-defined categories (signature). Click on the signature
for which you wish to view the data. The selected filter is highlighted with a red indication.
- Another way to filter the data leaks is based on the scan status, these are the following filters:
- All: The total number of data leaks discovered in all the scans. All is the sum of active,
inactive, and new filters. - Active: The total number of active data leaks (the data leaks that are still accessible over the internet)
discovered since the last scan. - Inactive: The total number of inactive data leaks (the ones discovered in the previous scans but not in the
latest scans) have been discovered since the last scan. - New: NVADR is a platform that performs continuous analysis to discover data leaks. The new filter will list
the most recently discovered data leaks. The user can apply the category filters and the scan status filters
simultaneously.
- All: The total number of data leaks discovered in all the scans. All is the sum of active,
- Mute Instance Option: The users are given an option to mute resolved or least significant recurring data leaks.
- To mute an instance, click on the bell icon at the right corner.
- A pop-up appears confirming to mute the instance. Click OK to confirm.
The user is notified with a success pop-up notification. - Once an instance has been muted the user will not be notified about the
same during the upcoming scans. - To unmute an instance, delete the same from the settings. We will learn
more about settings later in this document. - An option (near to the asset URL) to view the code segment with the data leak
is also provided.
Table Layout
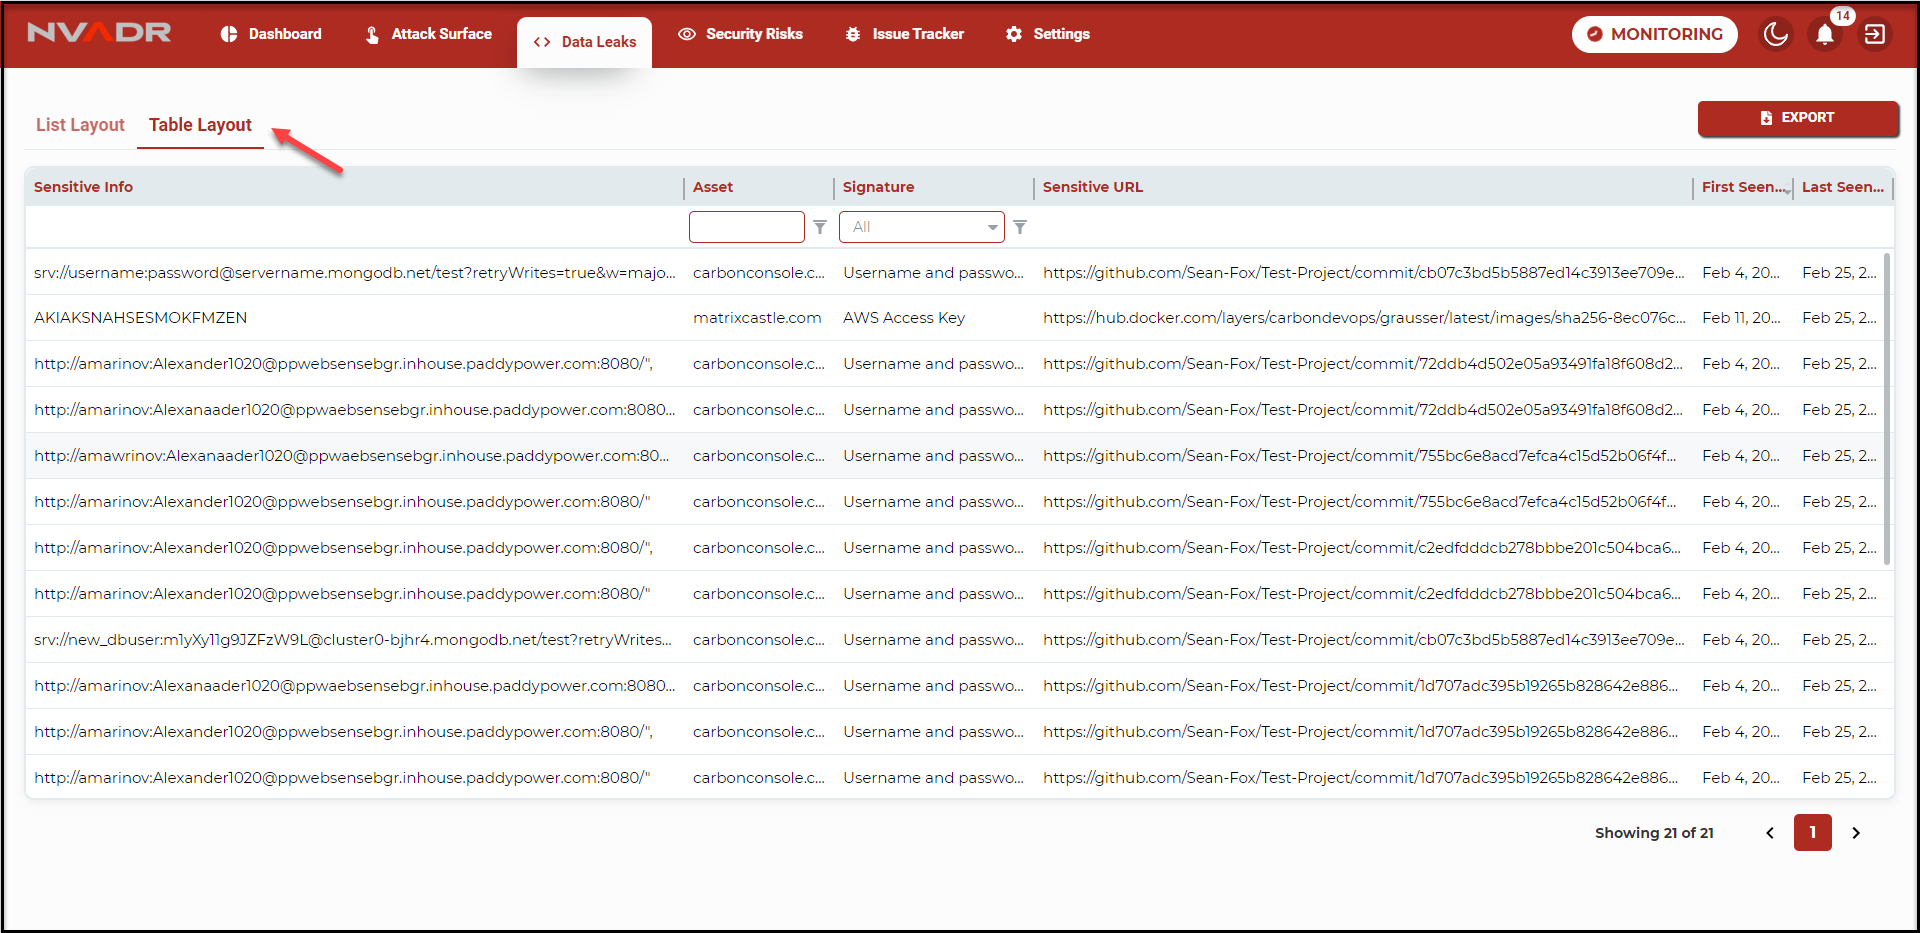
- The information under table layout is displayed in row and column format.
The filters are provided in the first row of the table. - The information can be filtered based on the asset and pre-defined signatures.
- Actions:
- To filter the data leaks based on the asset name, enter the same in the field provided.
- To filter the data leaks based on the signature, select the category from the signature
drop-down.
Security Risks
Security risks are the vulnerabilities found in the discovered assets. These security risks
are to be resolved at the earliest as they can be the cause of data breaches and cyber threats.
NVADR has a list of pre-defined security risks for fast and easy identification. These pre-defined
categories range from exposed sensitive data to expired licenses.
- Every identified security risk is listed under the security risks module. The data is automatically
updated through continuous analysis. - The total number of security risk instances discovered are displayed just below the header.
- Based on the type of layout selected by the user to view data, the security risk instances
can be filtered. - Mute instances and send to issue tracker are the other features provided under this module.
- Each security risk instance is provided the following information: Category name, Asset URL,
Severity status, First seen date, Last seen date.
List Layout
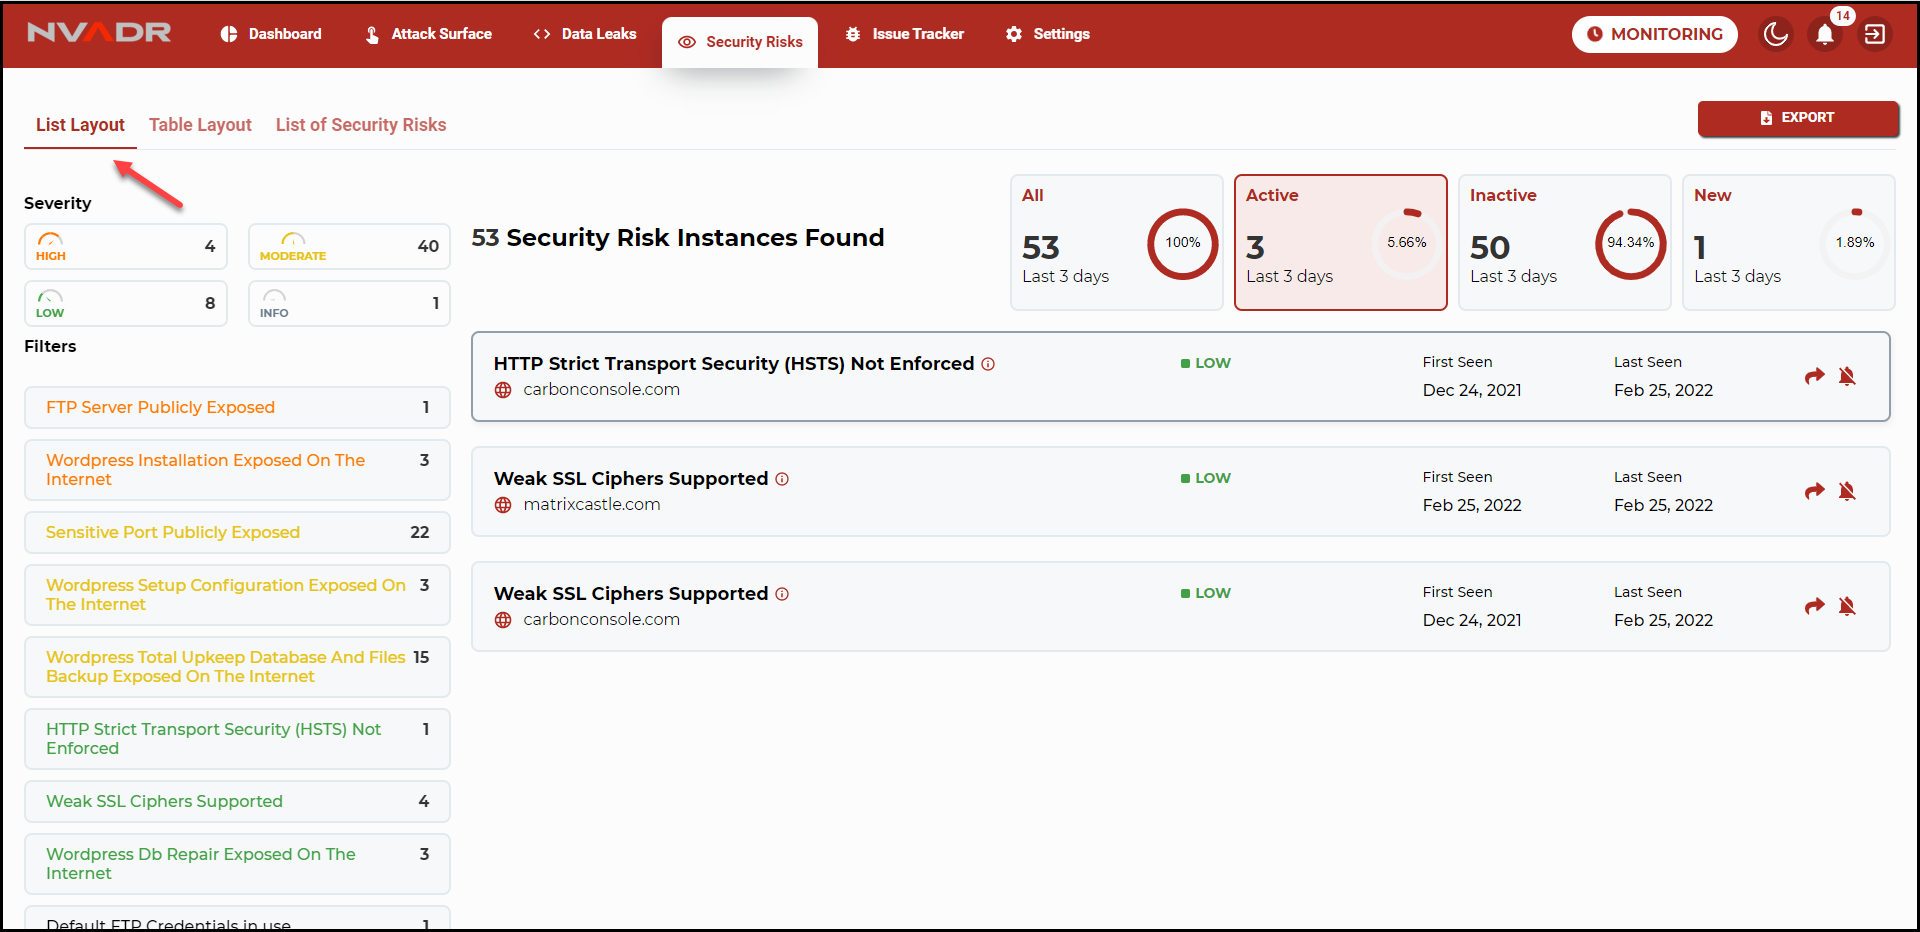
- In the list layout, the security risk instances are displayed in list format.
- The displayed information can be filtered based on the severity, category, and scan status of the instances.
- The users are also given the option to mute the instance and to directly send them to the issue tracker.
- To get a detailed summary of the discovered security risk instances, the user can click on the category name
of that particular instance. This will direct the user to the selected category, under "list of security risks"
sub-module.
Table Layout
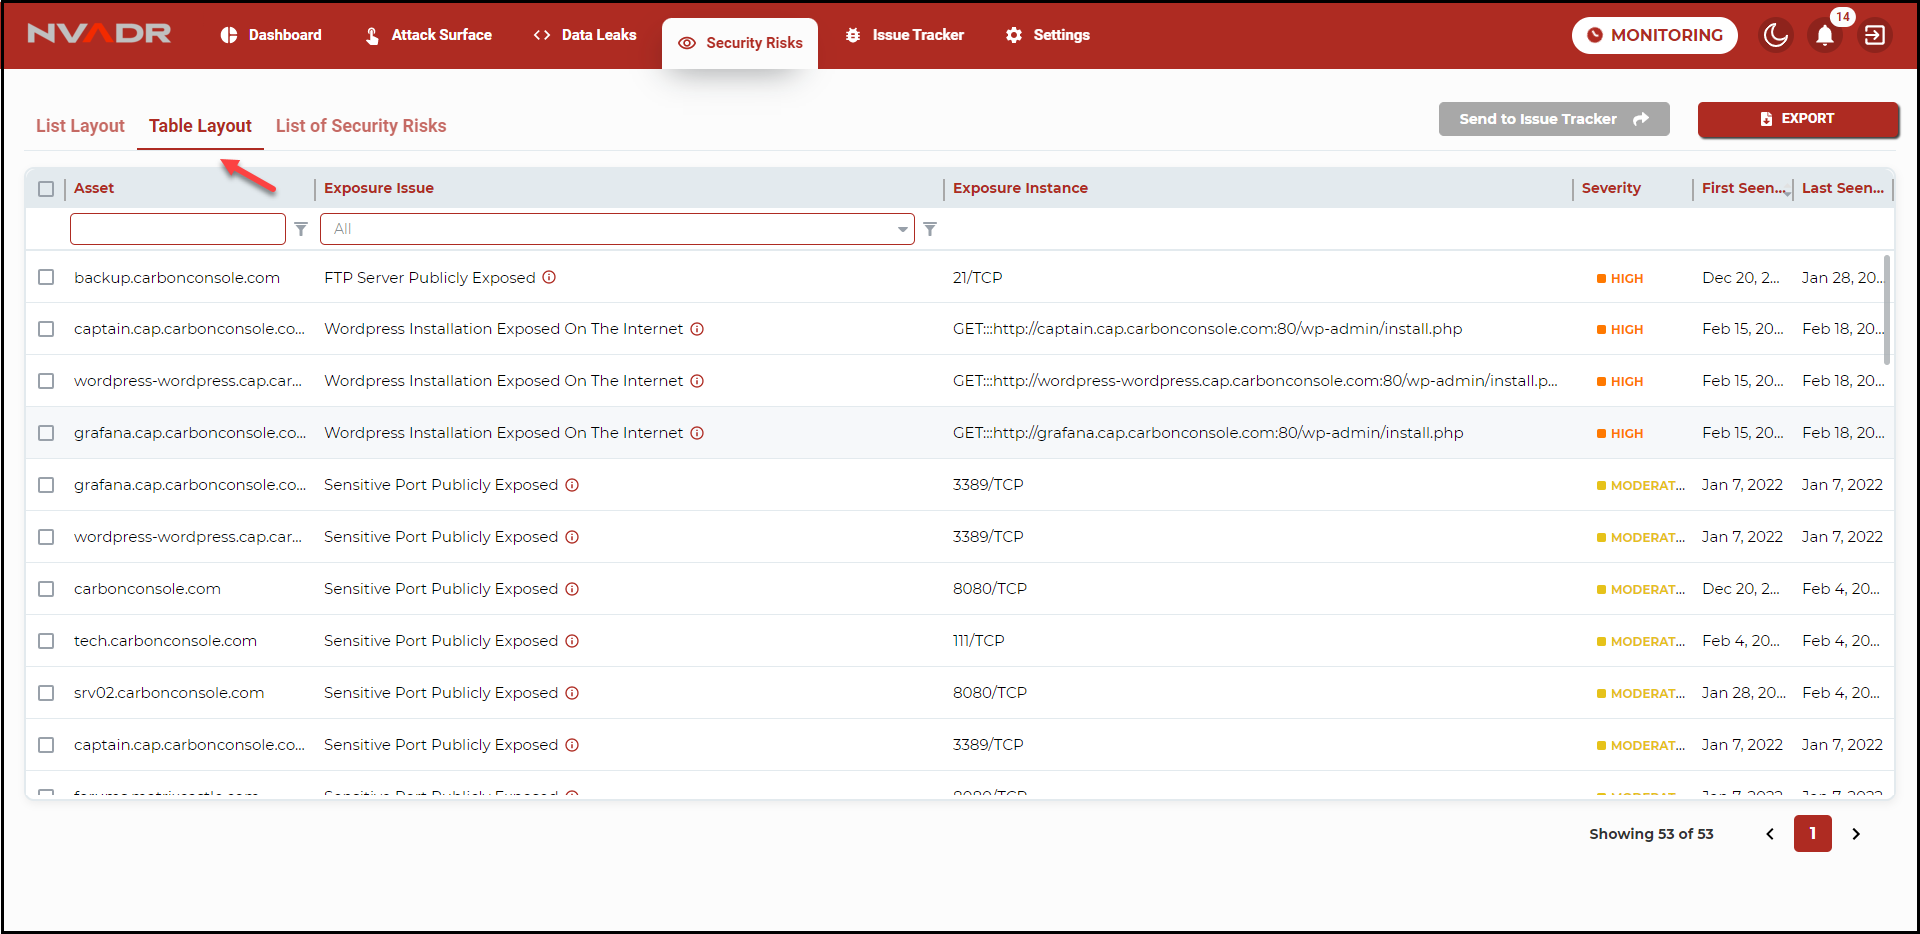
- In table layout, the instances are displayed in a row and column format to give the analyst a more
approachable design. - Both the list and table layout contains the same information.
- Additional information provided in this format is exposure instance. Exposure instance can be the
port number, the protocol used, the nature of the security risk, or the reason for the risk. - The user can send multiple security risk instances to the issue tracker by selecting the check box
provided to the left corner of each instance. Once they are selected, click on send to issue tracker. - Asset (asset URL) and exposure issue (security risk category) are the only two filters provided here.
- To learn more about the security risk category, click on the particular exposure issue. Just like the
list layout the user is direct to the list of security risks screen.
List of Security Risks
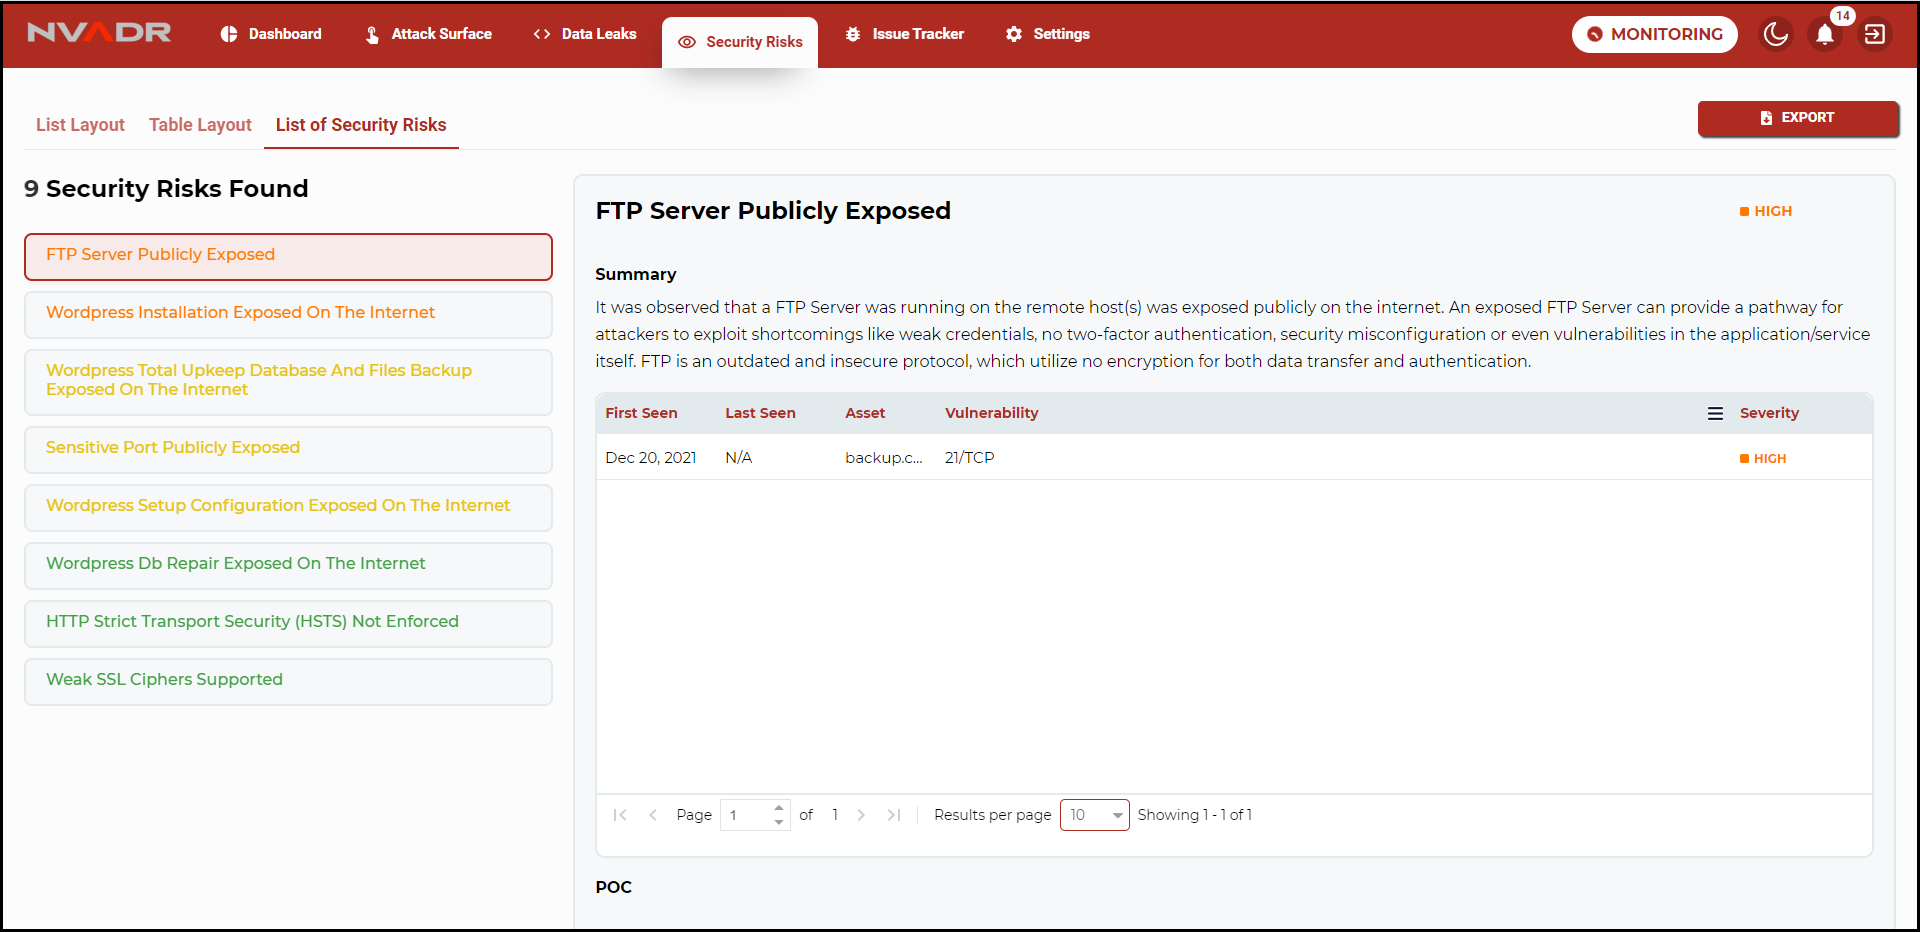
- As mentioned earlier, NVADR identifies and lists the security risk instances based on the pre-defined categories.
- Each pre-defined category is explained in detail under the list of security risks modules.
- All the identified security risk categories are listed on the left side of the screen.
- Each category is explained with,
- Summary: Description of Security Risk by NVADR
- POC
- Recommendation: Suggested fix/best practises for patching these Security Risk.
- Reference: Suggested readings for the Security Risk.
Actions
- Filters: Under security risks, filters are of three sets:
- Severity Filters:
- The users are given the option to filter the security risks based on the severity.
- Based on the severity of the security risk identified they are classified as critical, high, moderate, and low.
- The user can click on the required filter to view the list of vulnerabilities belonging to that particular severity
level.
- Category Filters:
- These are the set of pre-defined categories according to which the security risks are displayed.
- Click on the category for which the data is to be displayed. The selected category is highlighted in transparent red.
- Scan status Filters:
- Based on the status (after each scan), the instances can be filtered.
- The scan status filters are common for all the modules. They include all, active, inactive and new.
- Severity Filters:
- Mute Instances: The users are given the option to mute security risk instances. The user can mute any instance of their
choice. In the table layout, at the right corner of each security risk instance is a bell icon.
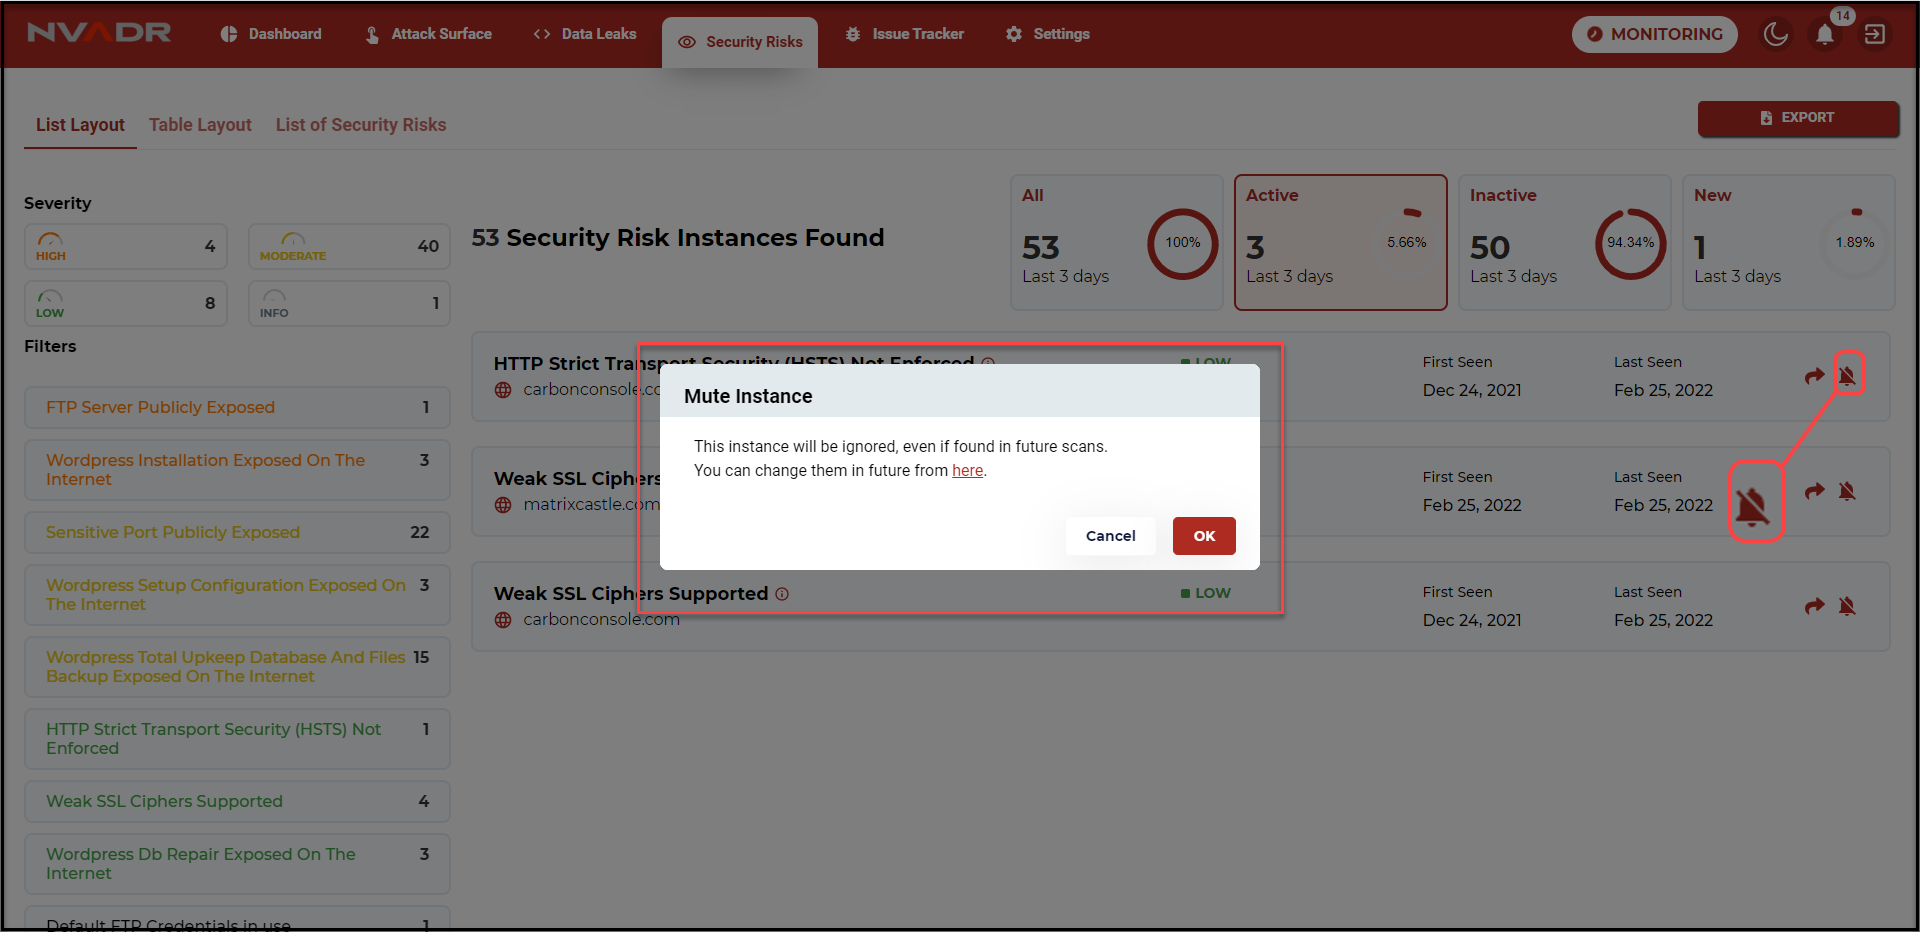
To mute an instance, click on the bell icon.
The mute instance pop-up appears. The pop-up contains a re-confirmation message and a link to unmute the instance.
The link directs the user to settings where the muted instances can be deleted (to unmute).Click OK to confirm. The user is notified with a success pop-up notification.
Once an instance has been muted the user will not be notified about the same during the upcoming scans.
Send to Issue Tracker: The security risks module is provided with an option, where the users can send a security
risk instance to the issue tracker. The issue tracker is a feature in NVADR that allows the admin users to assign an
issue (to resolve the issue) to other defined users.In the list layout, at the right end corner of each security risk instance, is an arrow icon.
Click on the arrow icon to send an instance to the issue tracker.
Once the user clicks on the icon, the send to issue tracker pop-up appears.
The pop-up contains the category of the selected security risk instance and a field to assign priority.
Priority indicates the importance level at which the issue is to be resolved.Once the priority level is selected click on Add.
All the instances with higher risks are send to the issue tracker.
In table layout, multiple instances can be sent to the issue tracker at once.
Select the checkboxes of the security risk instances that are to be tracked.
Click on send to issue tracker button provided at the top right corner of the
screen. The pop-up appears.Now, assign the priority and click on add. This will successfully send the selected
instances to the issue tracker.Note: The security risk instances already present under the issue tracker cannot be
sent again.
Issue Tracker
Issue tracker allows the user to monitor the progress in resolving a discovered security risk.
The security risk instances with critical and high severity are by default sent to the issue
tracker. Under the security risk module, the users are given the option to send any listed security
risk instance to the issue tracker.
List Layout
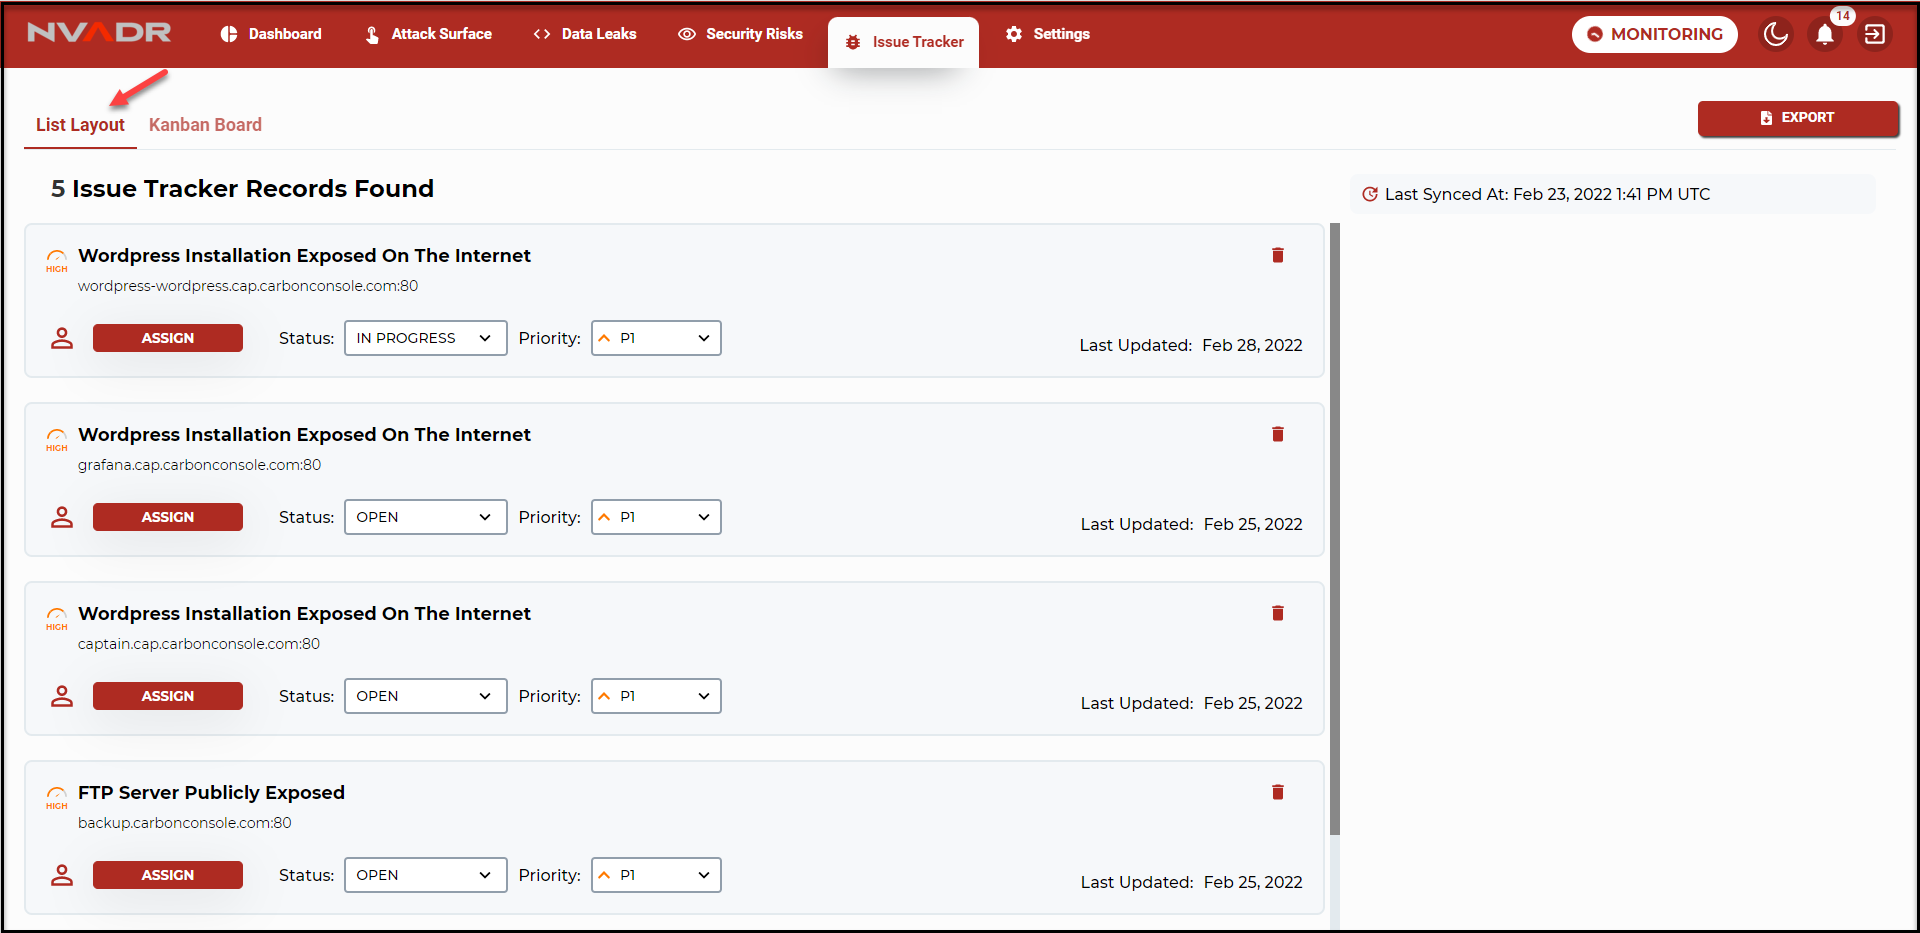
All the issues are displayed in a list format.
Each security risk issue can be assigned to a defined user under the organizations.
Assign:
- To assign a user, click on assign.
- From the assign user drop-down select the user. The user list is created by the organization
admin in settings. Settings will be explained in detail later in the document. - Click Add to assign the selected user.
Based on the progress in resolving the issue, the status can be updated to open,
in progress, closed and won't fix.The priority level of an issue can also be assigned based on the severity of the
vulnerability.
Kanban Board
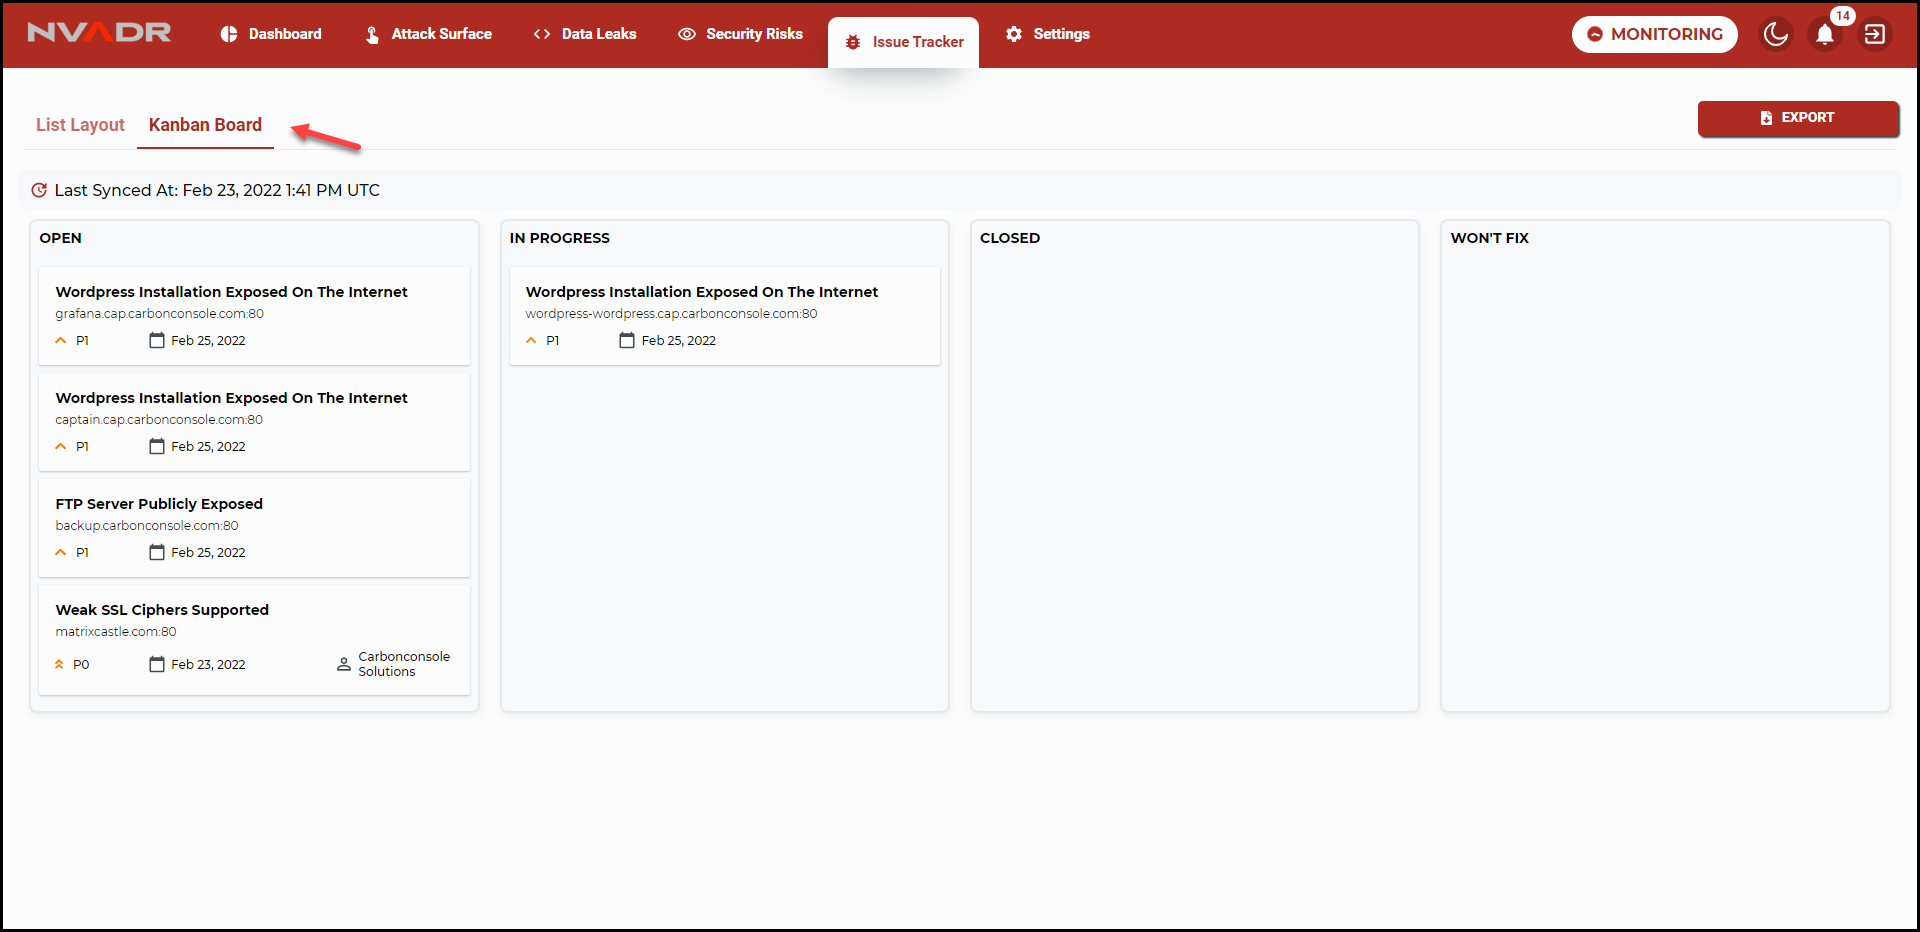
Kanban board provides a more user-friendly and easy approach to update the status of an issue.
The user can simply drag and drop an issue card to its corresponding status container.
Settings
Seed Information
NVADR requires very less information from any organization to discover their assets, and to identify
all the data leaks and security risks. This minimum information is called seed information. The
parent domain of an organization is the required seed information.
Actions:
- To add a domain click on the '+' icon provided. Enter the domain and click on add.
- Once the domain is added two verification methods are provided.
To know know more about the verification process, click here. - All the validated domains are displayed with a green indication. All the non-validated domains are provided with a grey indication.
- Another feature under seed information is the option to add other assets. You can add n number of other assets in the
'Other assets' section - To add an asset click on the '+' icon adjacent to the other assets heading. Enter the asset name and select the asset
type. Click on add to successfully complete the process.
Muted Instances
Data leaks and security risks modules are provided with the mute instance option. The user
can mute any instance, the muted instances will not appear in the future scans.
Under this module all the muted instances (from the data leaks and security risks module) are
displayed in a list format. The instances are displayed under their corresponding sections
i.e., security risks and data leaks.
Actions
- To unmute an instance, click on the delete icon provided.
Integrations
Cloud Connectors
Notifications
Communication channels used at your organization can be integrated with NVADR. Currently NVADR
supports integration with Slack. By integrating slack, you will receive notifications on the
platform for the events that you have selected. Events can be customised under preferences,
which is explained later in this document.
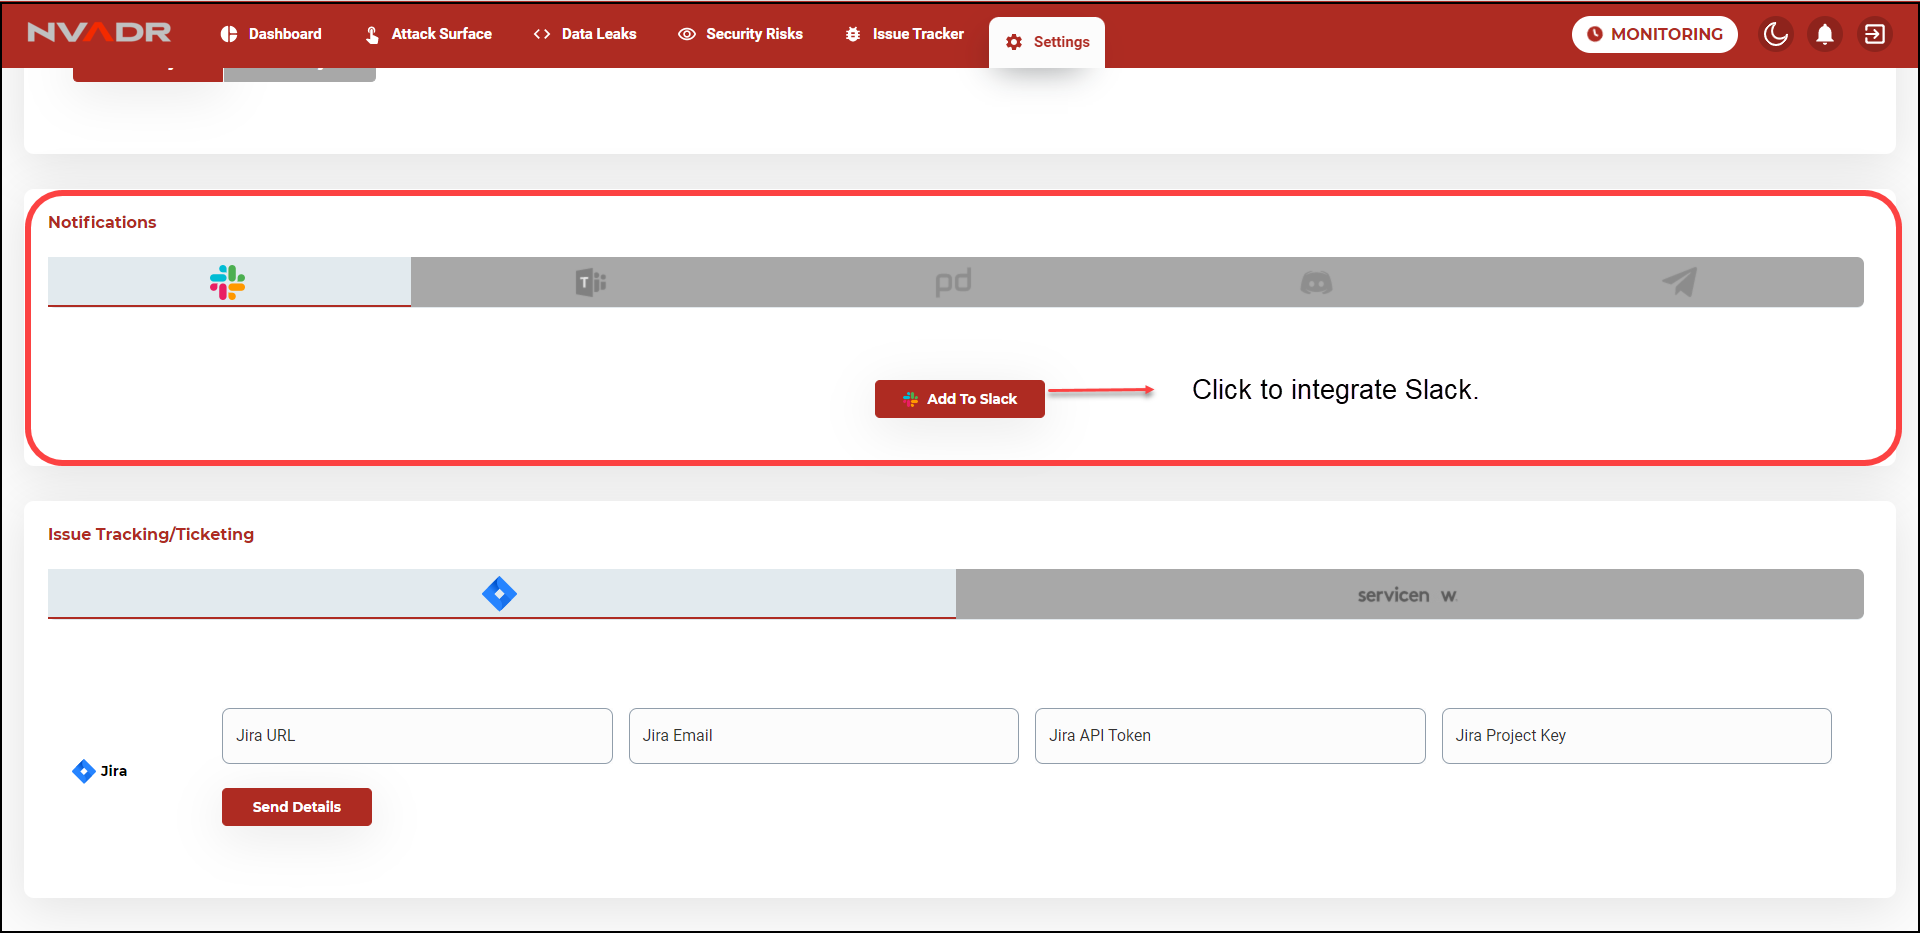
Learn more about slack integration, here.
Issue Tracking/Ticketing
Integrate your JIRA account with NVADR to track the progress in resolving any assigned issue.
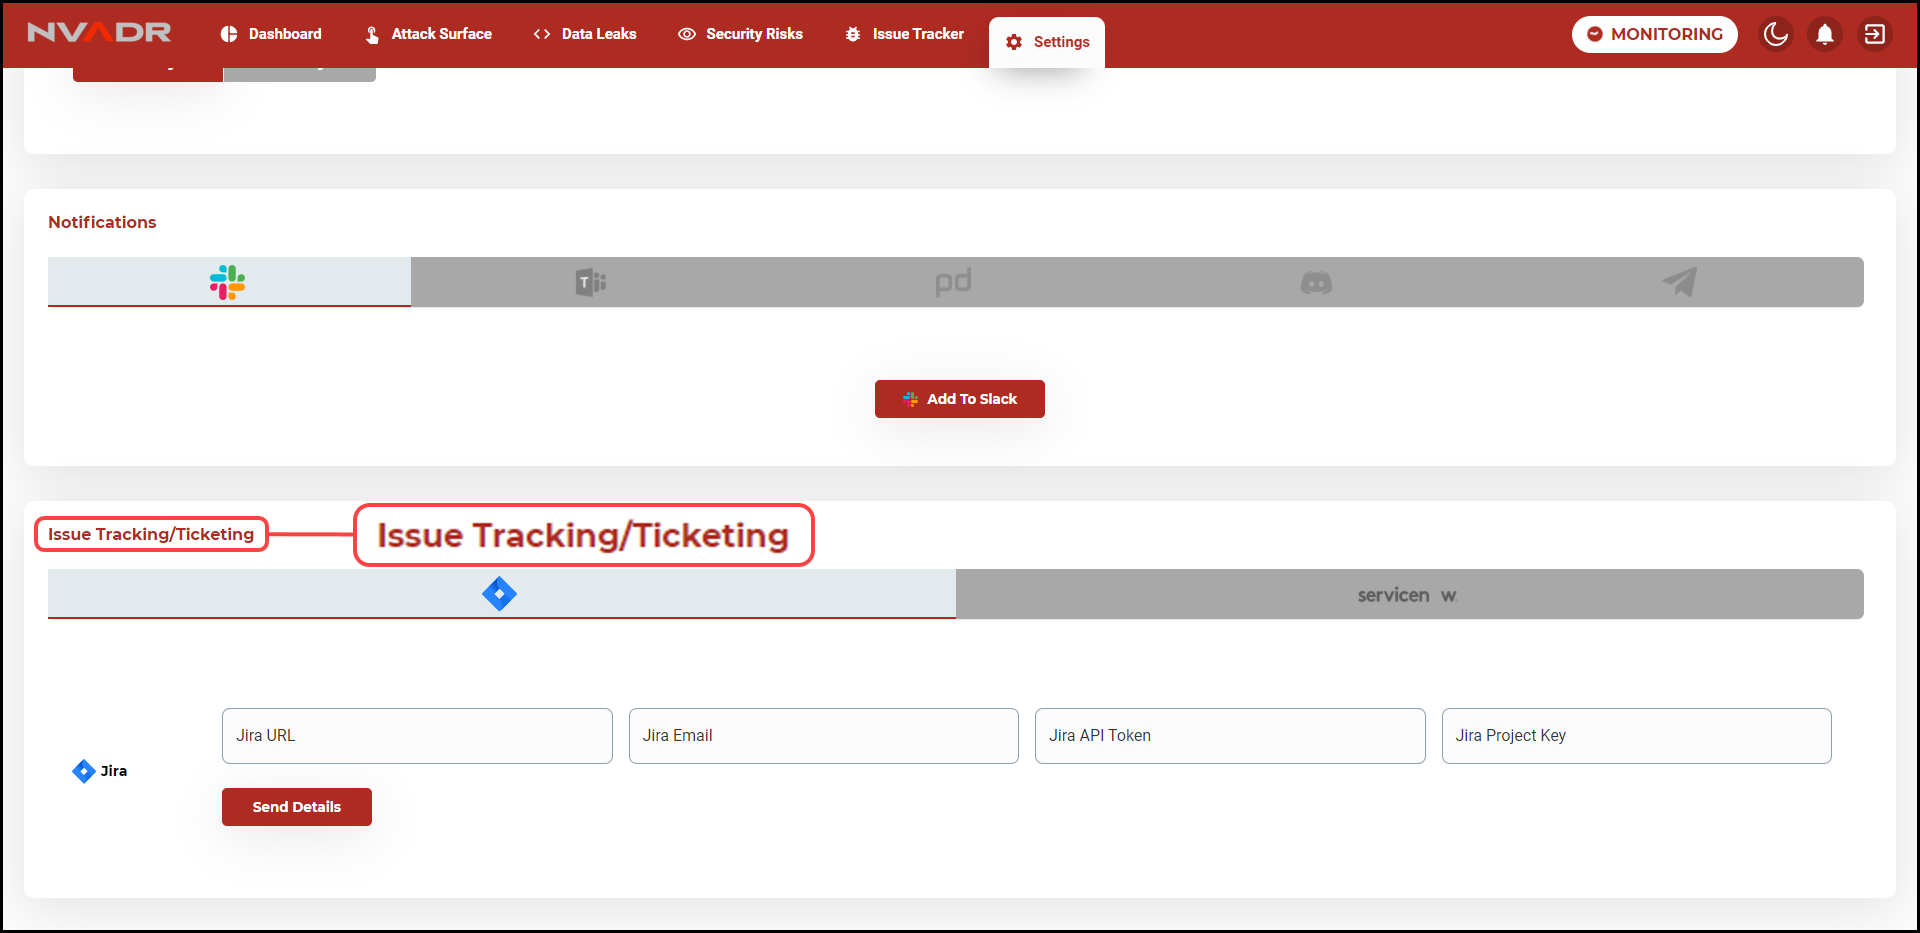
Learn more about JIRA integration, here.
Public API
Public API is an application programming interface provided to the clients by the owner of the platform.
API is used to transfer certain information from one interface to another.
Actions
- To generate an API, click on the generate API key button.
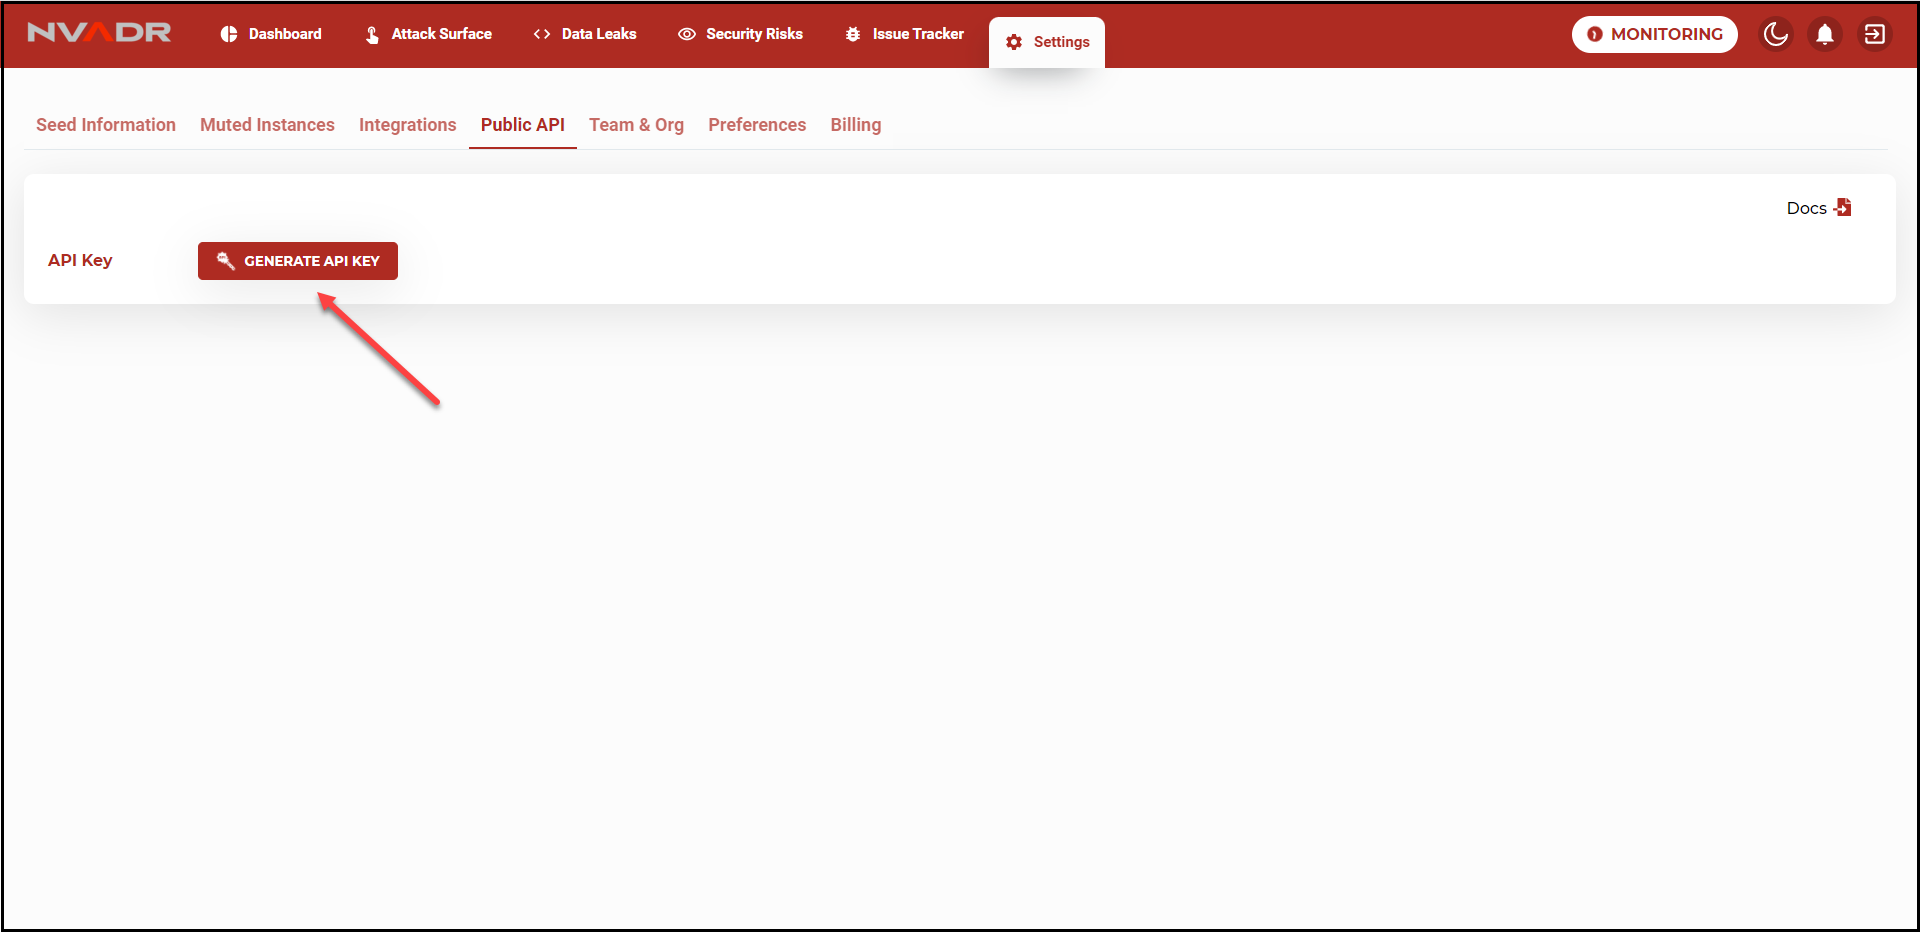
- Once an API is generated, you can update it by clicking on the regenerate button.
- An option to delete the API is also provided.
Team & Org
In simple words, Team & Org module is your organization profile settings. The organization
details are displayed here. The organization admin can add other members (of the organization)
to the NVADR platform. The existing and new member details are displayed under this module.
Actions
- The organization details can be edited. Click on edit details to make changes.
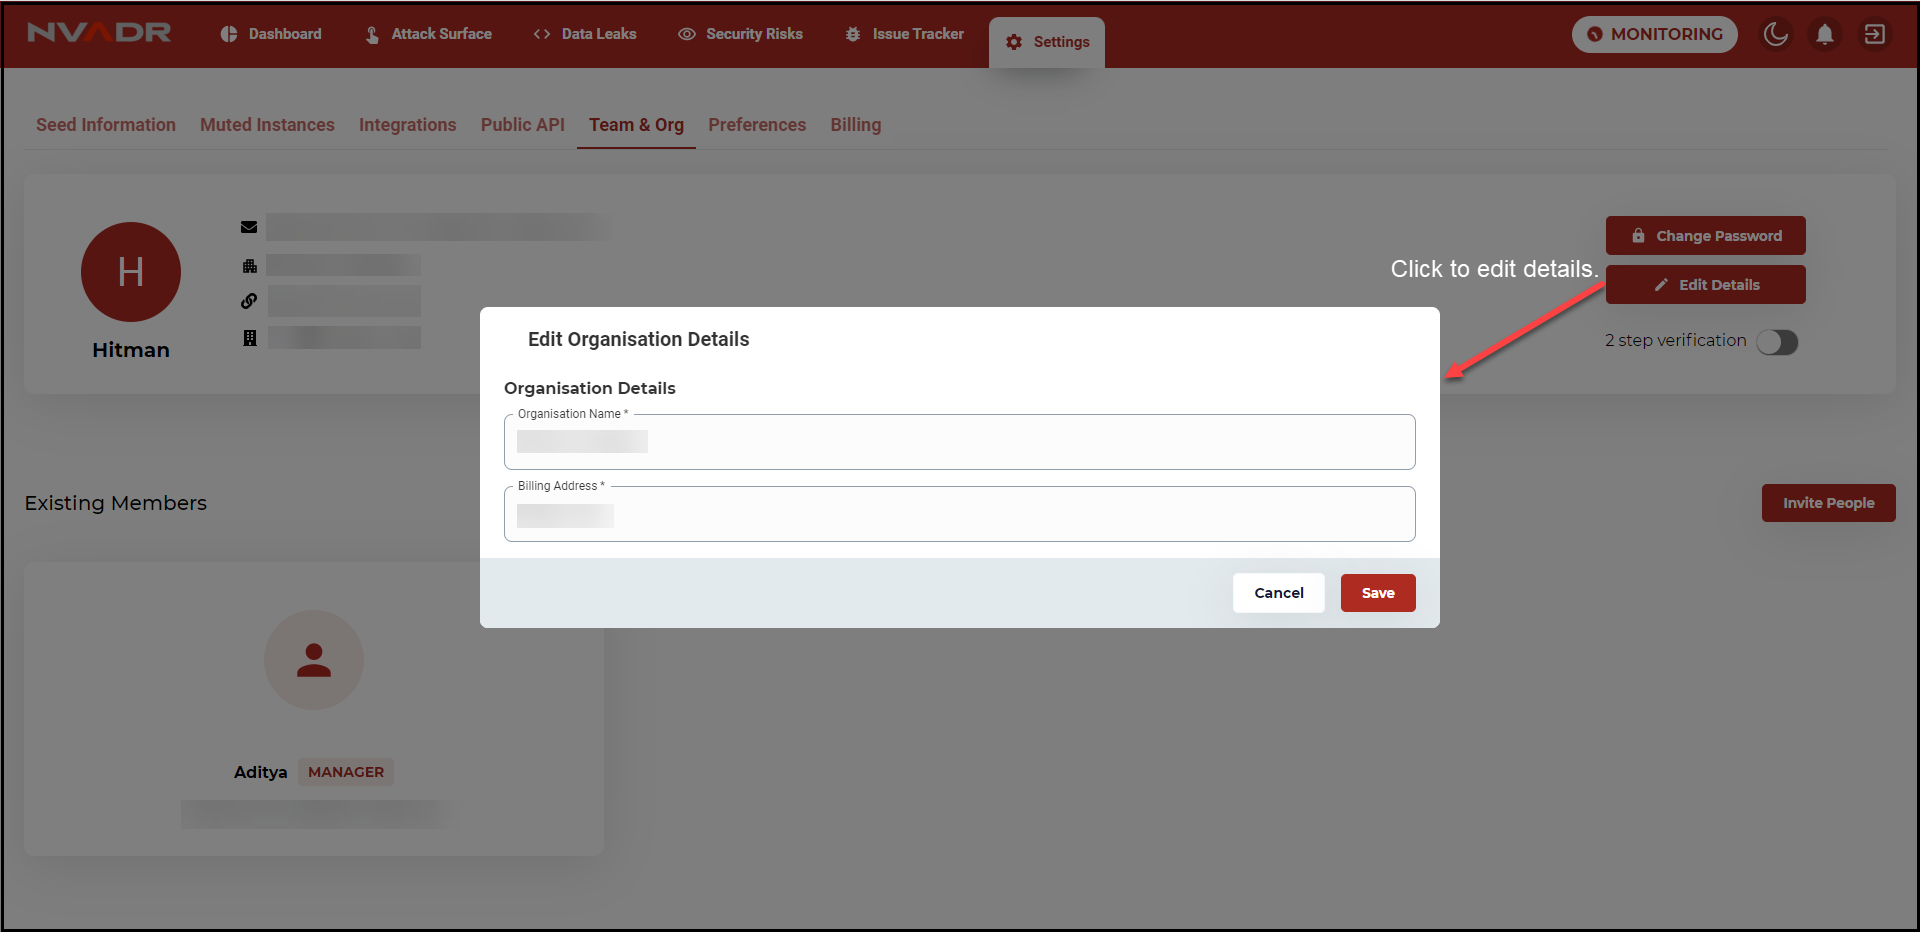
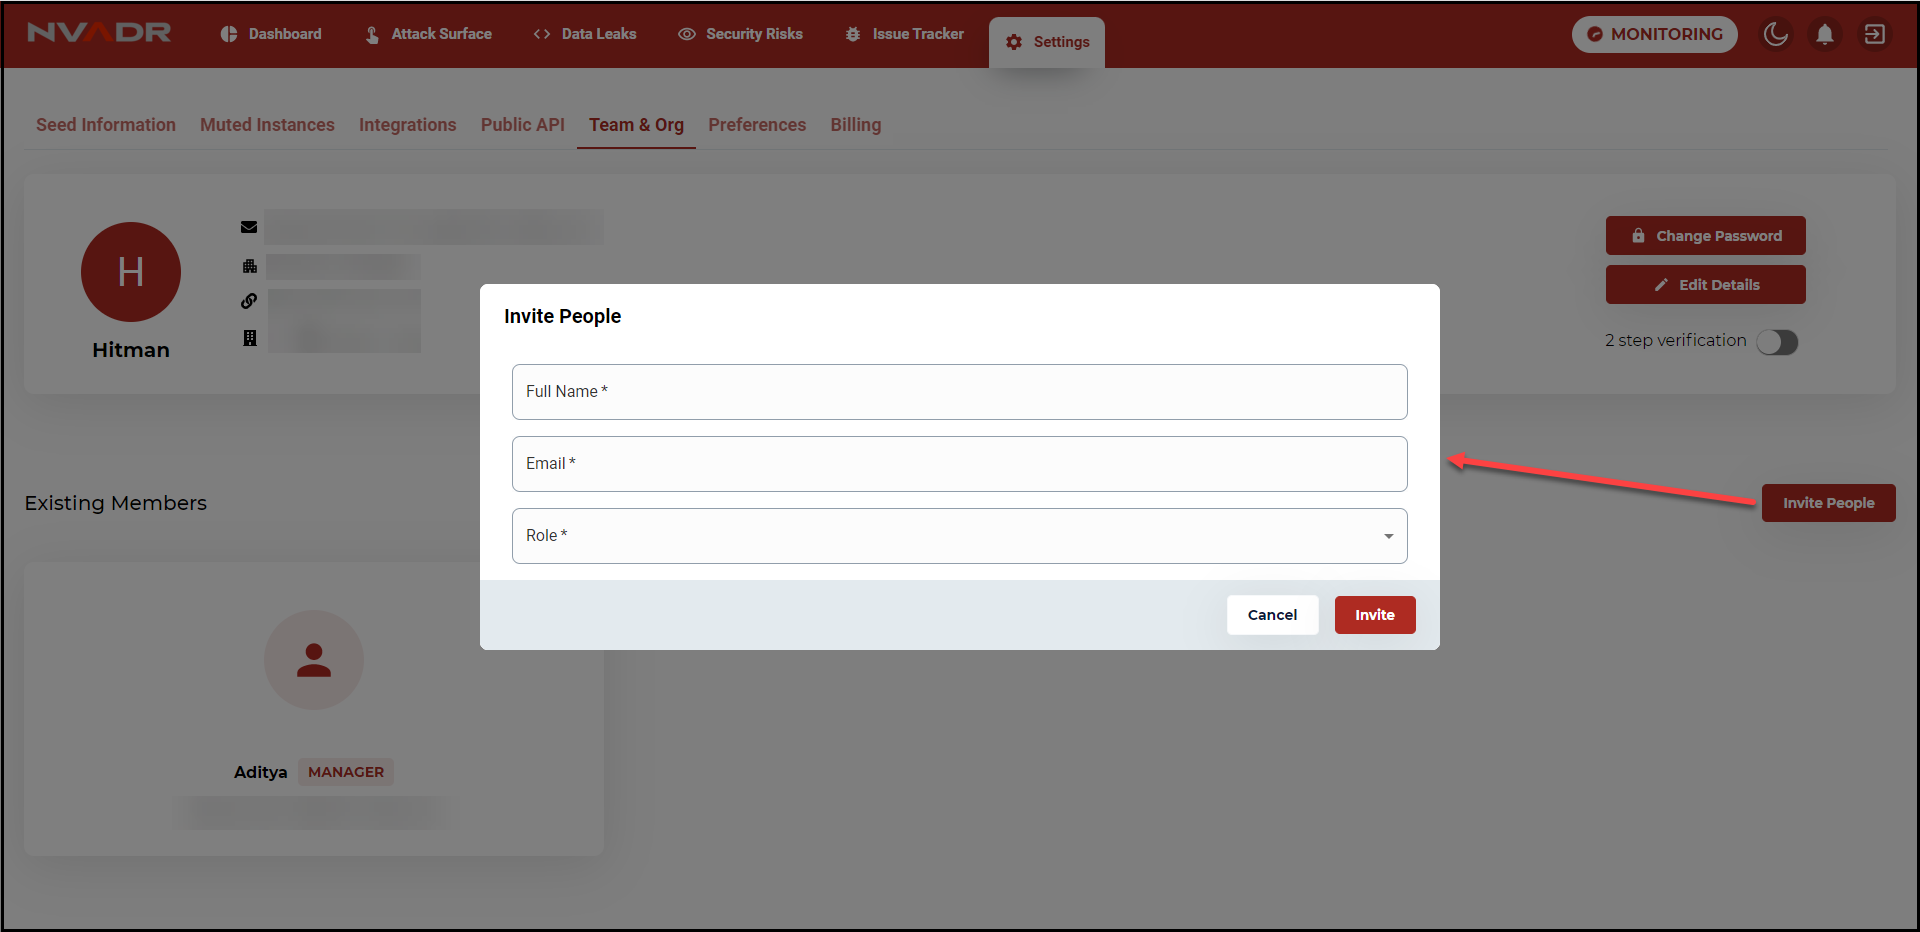
- New users can be invited and added to the platform. Click on invite people to
add new users.
- To provide a two level security to your account, NVADR is providing you with the
two-step verification feature.
Note:
- Same Email address cannot be used under two organizations.
- NVADR doesn't support non-business (gmail.com) email addresses.
Preferences
We have already discussed on how to integrate the communication channels with NVADR.
Under preferences you can customise the events for which you wish to receive notifications.
Actions
- Select the medium i.e., Email and Slack (adjacent to the events) on which you wish to
receive the notifications. - Click on update to save the changes.
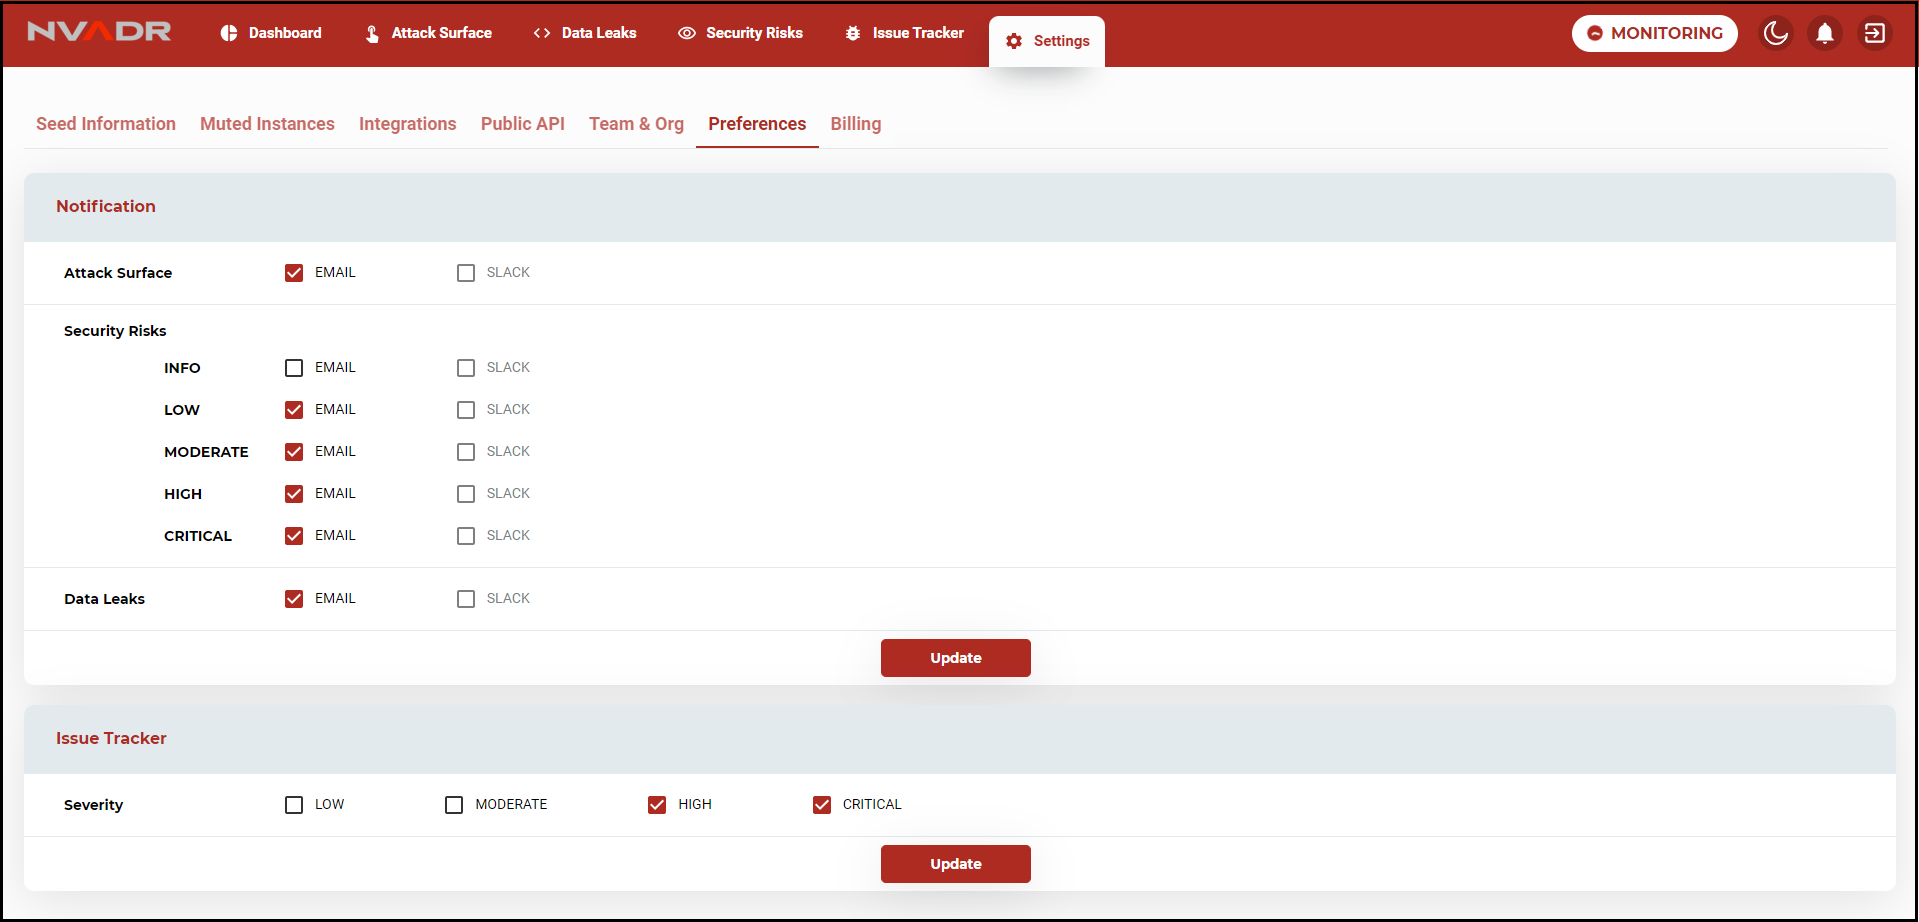
- You can also customise the severity levels of the security risk instances. By default the
instances with the selected severity level will be sent to the issue tracker.
How to integrate my JIRA account with NVADR for issue tracking?
- Integrating JIRA will make the task of tracking the issues and their progress easy.
- Go to settings ⟶ Integrations ⟶ issue tracking/ticketing.
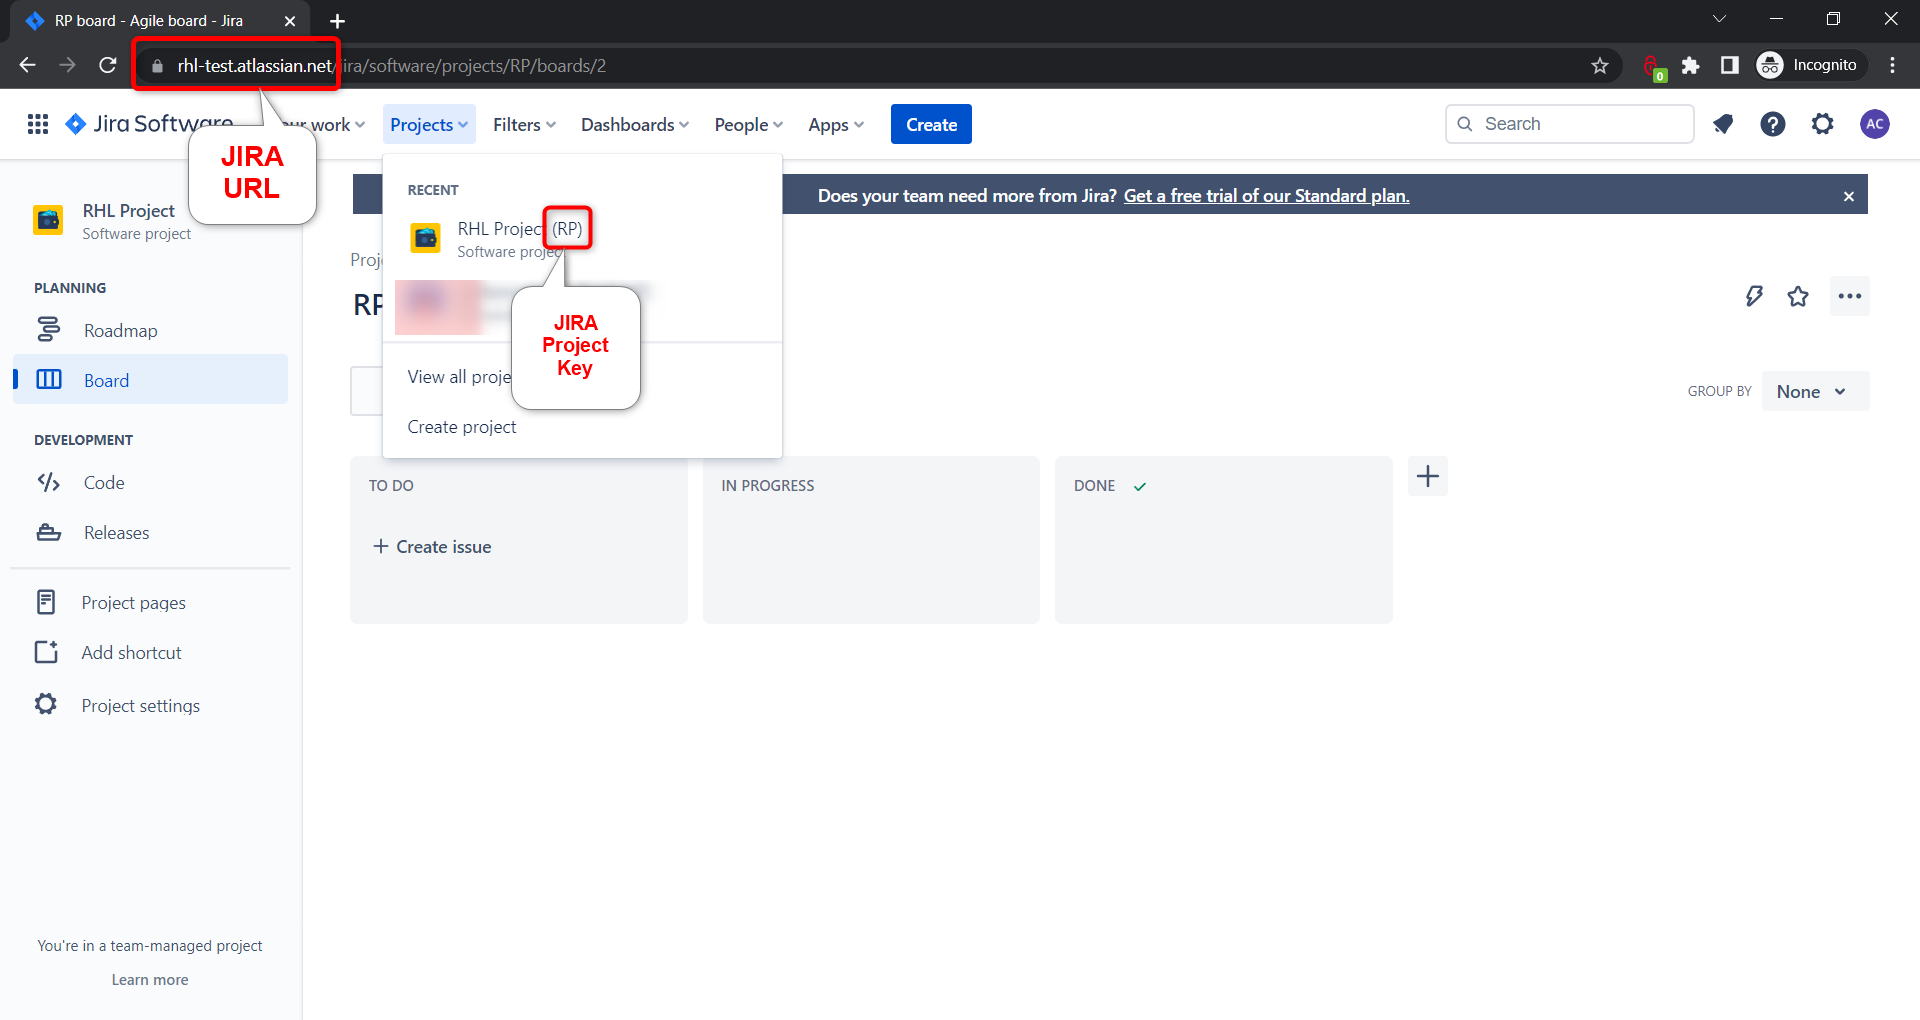
- Provide your JIRA URL, Email, API Token and JIRA project key.
- You use the JIRA URL to access your JIRA projects & tickets. If you are using
JIRA cloud, it will look like this [https://your-company-name.atlassian.net]. - JIRA Email will be the email-ID you use to access the JIRA software and with
which you will generate the API token. - Here is a link on how to create your JIRA API Token -
https://support.atlassian.com/atlassian-account/docs/manage-api-tokens-for-your-atlassian-account/ - The Project key is a unique identifier of your project where you will track all the issues.
- You use the JIRA URL to access your JIRA projects & tickets. If you are using

Once all the details are provided, click on send details.
You will be required to select an Issue Type to complete the integration.
After the JIRA account is added to the NVADR platform, the next step is to configure the JIRA board.
Click on the configure option provided.
Drag and drop statuses to map your JIRA status with your NVADR status.
Click on update to save the changes.
Now you can easily track your issue status through your JIRA account.
Export All Issues from Tracker to JIRA Project
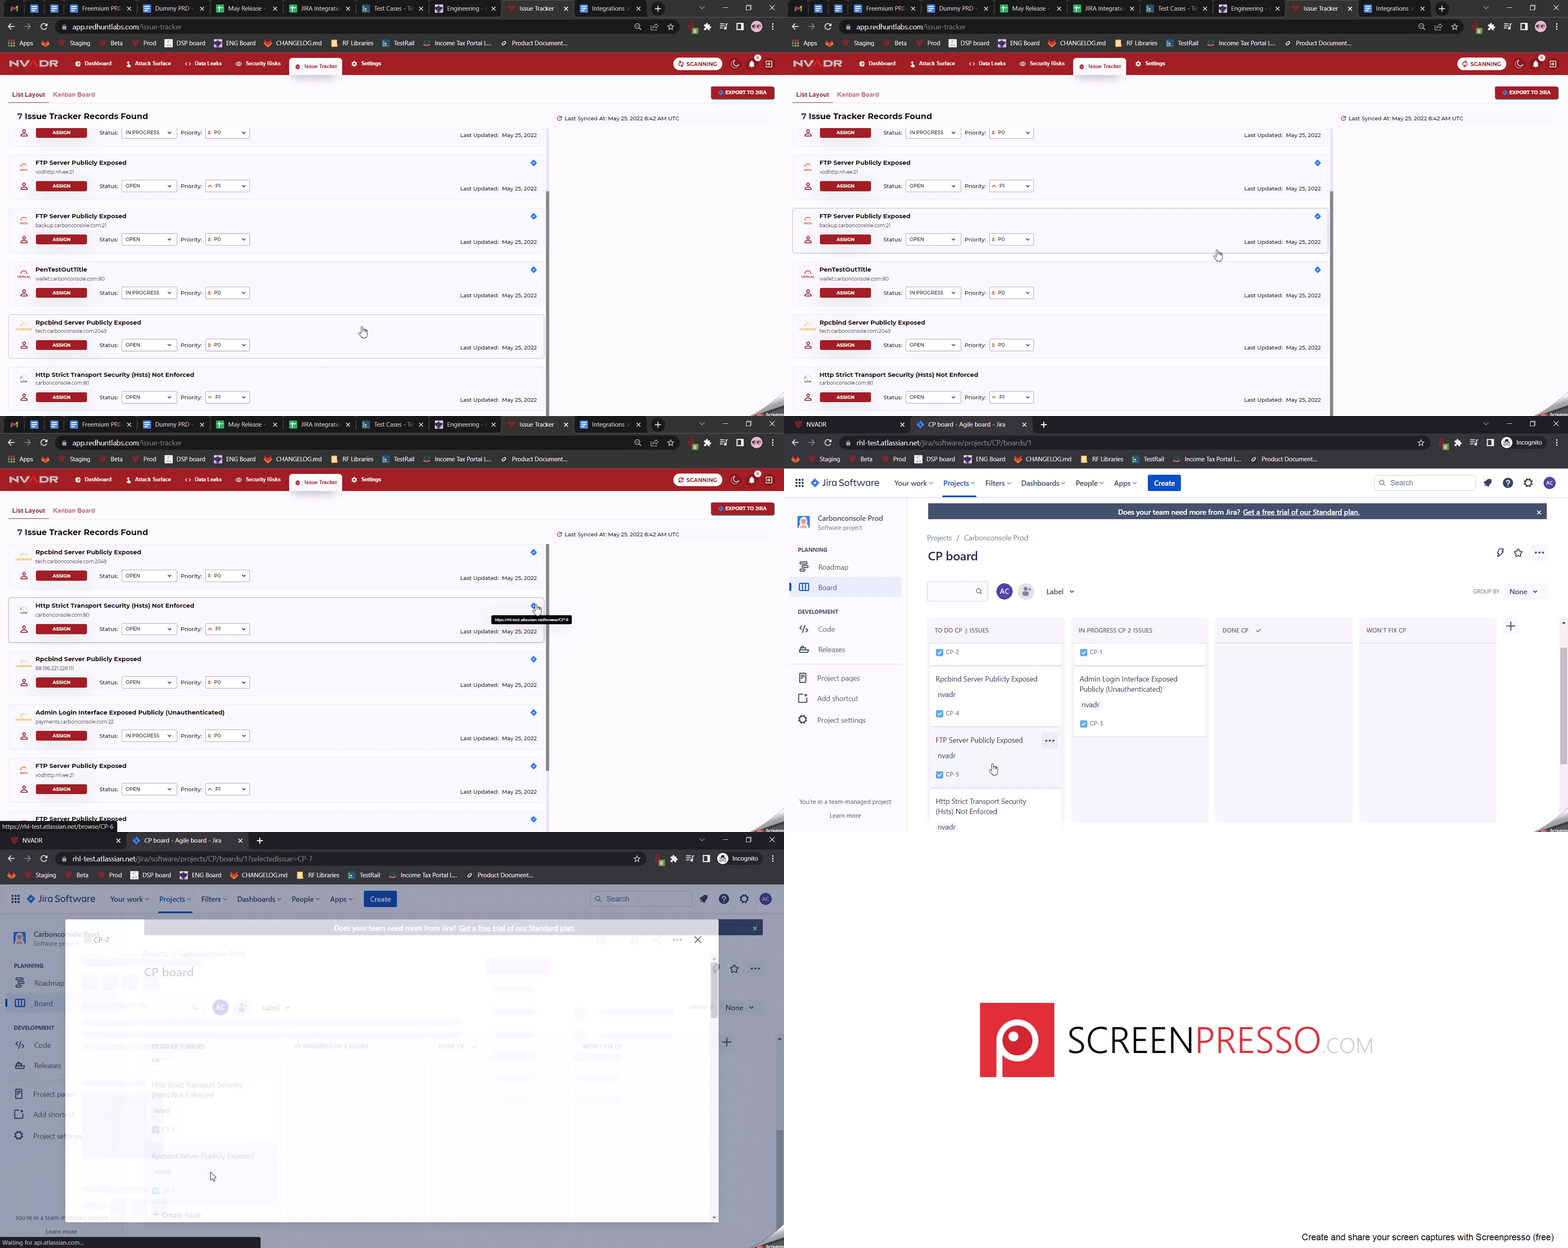
- After you have set up their integration, you can export all their issues with the click of a
single button ‘Export To JIRA’. This will sync all the issues listed in the tracker with
your JIRA project along with their statuses.
Sync your comments
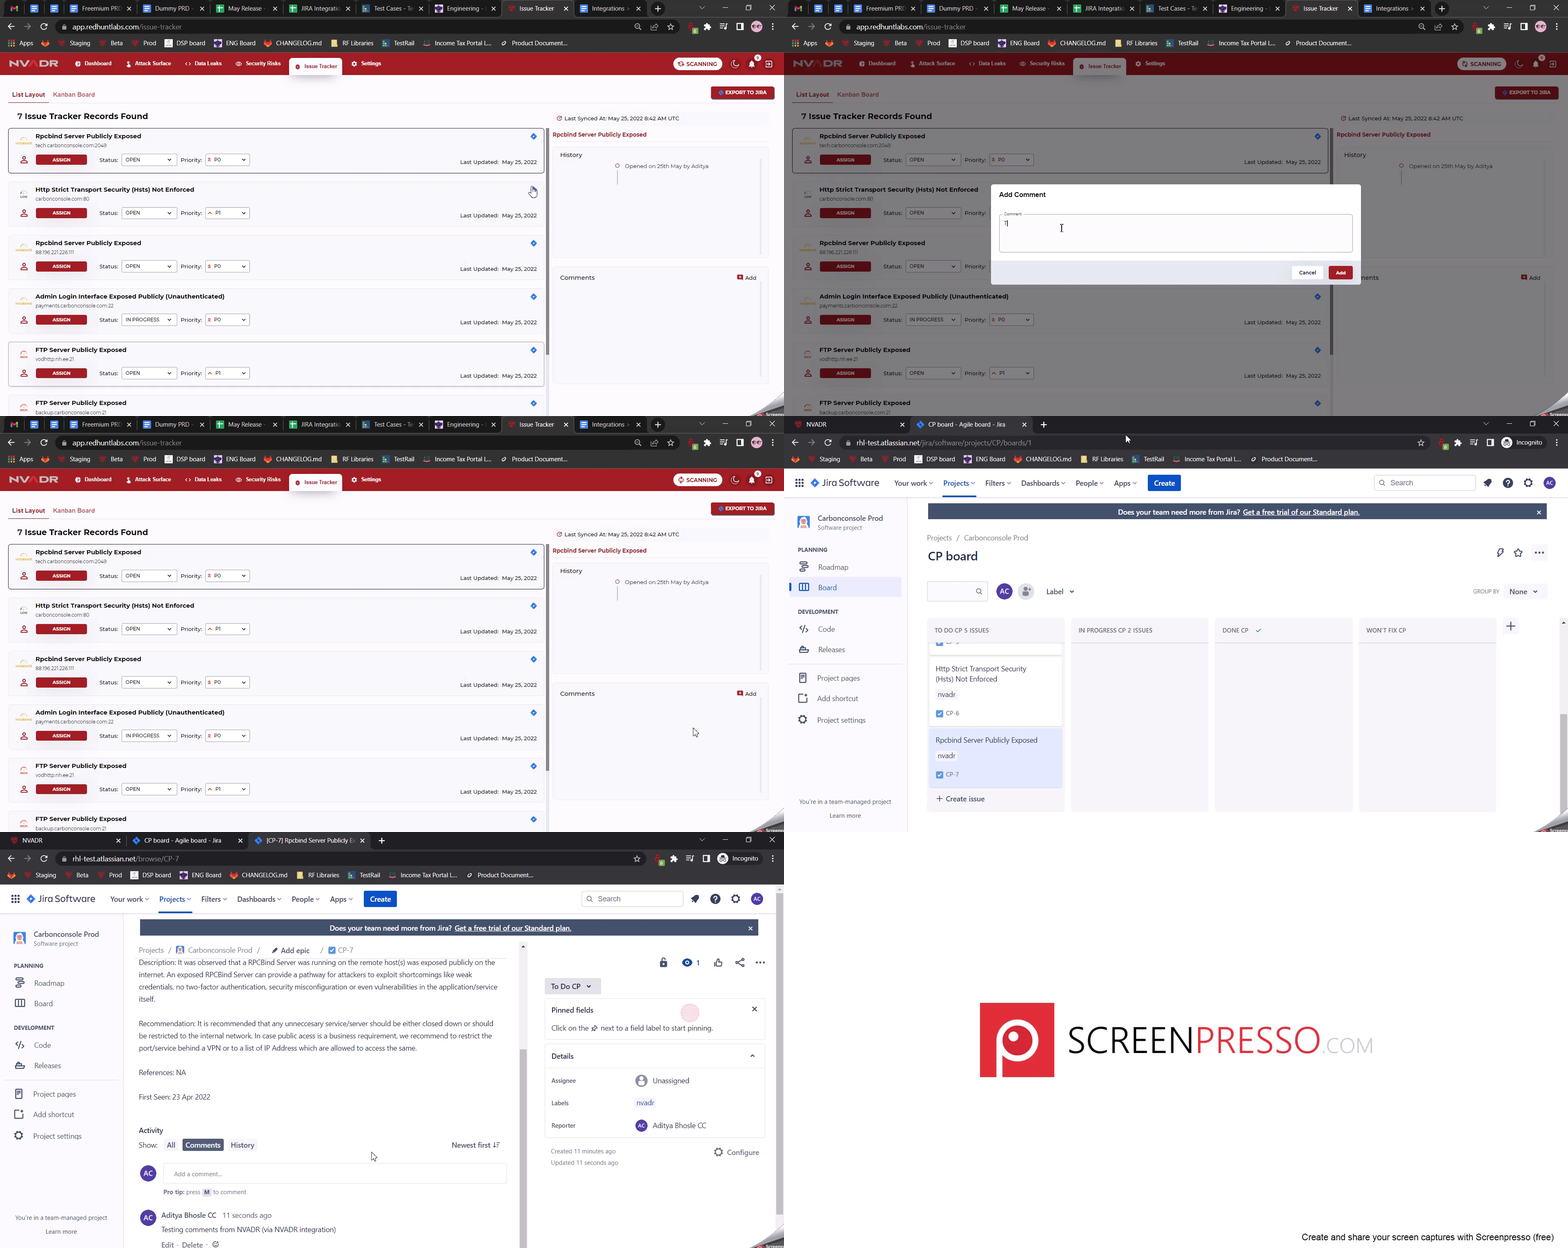
- Comments under any issue on the NVADR tracker will be synced to the corresponding issue on JIRA immediately,
and comments in any issue on JIRA will be synced to NVADR tracker after an interval of 15 minutes.
AWS ARN
In order to extract the resources from client-side, the tool expects the users to follow the below steps in order to provide the necessary permissions and input.
Open the Roles section from the IAM page of the AWS Console
Click on Create Role
Choose the AWS Account box
Click on the "Another AWS Account" radio button
Enter the following 12 digit Account ID (647087456535)
Choose the Require external ID checkbox
Provide it with a random string (eg: dijasduoheuhsoifh)
Click on Next
In Permission Policies section, click on the Create Policy button which will open a new page
Click on the JSON tab
Paste the following JSON:
{"Version": "2012-10-17","Statement": [{"Effect": "Allow","Action": ["eks:*","lightsail:*"],"Resource": "*"},{"Action": ["mediastore:Get*","mediastore:List*","mediastore:Describe*"],"Effect": "Allow","Resource": "*","Condition": {"Bool": {"aws:SecureTransport": "true"}}},{"Effect": "Allow","Action": "ec2:Describe*","Resource": "*"},{"Effect": "Allow","Action": "elasticloadbalancing:Describe*","Resource": "*"},{"Effect": "Allow","Action": ["cloudwatch:ListMetrics","cloudwatch:GetMetricStatistics","cloudwatch:Describe*"],"Resource": "*"},{"Effect": "Allow","Action": "autoscaling:Describe*","Resource": "*"},{"Effect": "Allow","Action": ["route53:Get*","route53:List*","route53:TestDNSAnswer"],"Resource": ["*"]},{"Effect": "Allow","Action": ["s3:Get*","s3:List*","s3-object-lambda:Get*","s3-object-lambda:List*"],"Resource": "*"},{"Effect": "Allow","Action": ["apigateway:*"],"Resource": "arn:aws:apigateway:*::/*"},{"Effect": "Allow","Action": ["acm:ListCertificates","cloudfront:DescribeFunction","cloudfront:Get*","cloudfront:List*","iam:ListServerCertificates","route53:List*","waf:ListWebACLs","waf:GetWebACL","wafv2:ListWebACLs","wafv2:GetWebACL"],"Resource": "*"},{"Effect": "Allow","Action": "elasticloadbalancing:Describe*","Resource": "*"},{"Effect": "Allow","Action": ["ec2:DescribeInstances","ec2:DescribeClassicLinkInstances","ec2:DescribeSecurityGroups"],"Resource": "*"},{"Effect": "Allow","Action": "arc-zonal-shift:GetManagedResource","Resource": "arn:aws:elasticloadbalancing:*:*:loadbalancer/*"},{"Effect": "Allow","Action": ["arc-zonal-shift:ListManagedResources","arc-zonal-shift:ListZonalShifts"],"Resource": "*"},{"Sid": "AllowAPIs","Effect": "Allow","Action": ["acm:ListCertificates","autoscaling:DescribeAccountLimits","autoscaling:DescribeAutoScalingGroups","autoscaling:DescribeAutoScalingInstances","autoscaling:DescribeLaunchConfigurations","autoscaling:DescribePolicies","autoscaling:DescribeLoadBalancers","autoscaling:DescribeNotificationConfigurations","autoscaling:DescribeScalingActivities","autoscaling:DescribeScheduledActions","cloudformation:DescribeStackResource","cloudformation:DescribeStackResources","cloudformation:DescribeStacks","cloudformation:GetTemplate","cloudformation:ListStackResources","cloudformation:ListStacks","cloudformation:ValidateTemplate","cloudtrail:LookupEvents","cloudwatch:DescribeAlarms","cloudwatch:GetMetricStatistics","cloudwatch:ListMetrics","ec2:DescribeAccountAttributes","ec2:DescribeAddresses","ec2:DescribeImages","ec2:DescribeInstanceAttribute","ec2:DescribeInstances","ec2:DescribeInstanceStatus","ec2:DescribeKeyPairs","ec2:DescribeLaunchTemplateVersions","ec2:DescribeLaunchTemplates","ec2:DescribeSecurityGroups","ec2:DescribeSnapshots","ec2:DescribeSpotInstanceRequests","ec2:DescribeAvailabilityZones","ec2:DescribeSubnets","ec2:DescribeVpcs","elasticbeanstalk:Check*","elasticbeanstalk:Describe*","elasticbeanstalk:List*","elasticbeanstalk:RequestEnvironmentInfo","elasticbeanstalk:RetrieveEnvironmentInfo","elasticloadbalancing:DescribeInstanceHealth","elasticloadbalancing:DescribeLoadBalancers","elasticloadbalancing:DescribeSSLPolicies","elasticloadbalancing:DescribeTargetGroups","elasticloadbalancing:DescribeTargetHealth","iam:GetRole","iam:ListAttachedRolePolicies","iam:ListInstanceProfiles","iam:ListRolePolicies","iam:ListRoles","iam:ListServerCertificates","rds:DescribeDBEngineVersions","rds:DescribeDBInstances","rds:DescribeOrderableDBInstanceOptions","rds:DescribeDBSnapshots","s3:ListAllMyBuckets","sns:ListSubscriptionsByTopic","sns:ListTopics","sqs:ListQueues"],"Resource": "*"},{"Sid": "AllowS3","Effect": "Allow","Action": ["s3:GetObject","s3:GetObjectAcl","s3:GetObjectVersion","s3:GetObjectVersionAcl","s3:GetBucketLocation","s3:GetBucketPolicy","s3:ListBucket"],"Resource": "arn:aws:s3:::elasticbeanstalk-*"}]}
- Click on "Next: Tags" button
- Click on "Next: Review" button
- Add some name for the role (eg: cloudhunt-demo-policy)
- Click on Create Policy
- Now go back to the previous browser tab where you were creating the role
- Click on the refresh button on the left-hand side of "Create Policy" button
- The policy you created earlier will now appear in the list! Choose the policy by clicking on the checkbox on its left-hand side
- Scroll down to click on the Next button
- Provide with a role name (eg: cloudhunt-demo-role)
- Click on Create Role
- Once the role is created, refresh the roles list and click on the role name you had created
- Click on the Trust Relationships tab
- Click on "Edit trust policy" button
- Replace the JSON to remove the contents of the Condtion field,Example: Before
{"Version": "2012-10-17","Statement": [{"Effect": "Allow","Principal": {"AWS": "arn:aws:iam::675351422352:root"},"Action": "sts:AssumeRole","Condition": {"StringEquals": {"sts:ExternalId": "dijasduoheuhsoifh"}}}]}
{"Version": "2012-10-17","Statement": [{"Effect": "Allow","Principal": {"AWS": "arn:aws:iam::675351422352:root"},"Action": "sts:AssumeRole","Condition": {}}]}
- Click on Update policy
- Copy the ARN value from the summary section from the top of the page (It has the following structure: arn:aws:iam::575128592515:role/cloudhunt-demo-role)
- Provide the Portal with the following values: 1 - External ID which you entered in the 7th step 2 - ARN Value which you copied in the last step
PagerDuty + NVADR Integration Benefits
- Notify on-call responders based on alerts sent from NVADR.
- Receive enriched event data from NVADR that triggered the event.
- Receive incidents based on the severity of the event from the NVADR.
How it Works
Whenever NVADR find a security risk that fall outside of a designated range, it will
send an event to a service in PagerDuty. Events from NVADR will trigger a new incident
on the corresponding PagerDuty service, or group as alerts into an existing incident.
Requirements
PagerDuty integrations require an Admin base role for account authorization.
If you do not have this role, please reach out to an Admin within your organization
to configure the integration.
Support
If you need help with this integration, please contact support@redhuntlabs.com.
Integration Walkthrough
In PagerDuty
- From the
Configurationmenu, selectServices. - There are two ways to add an integration to a service:
- If you are adding your integration to an existing service: Click the
nameof the
service you want to add the integration to. Then, select theIntegrationstab and
click theNew Integrationbutton. - If you are creating a new service for your integration: Please read our documentation
in section Configuring Services and Integrations and follow the steps outlined in the
Create a New Service section, selectingNVADRas theIntegration Typein step 4.
Continue with the InNVADRsection (below) once you have finished these steps.
- If you are adding your integration to an existing service: Click the
- Enter an
Integration Namein the formatmonitoring-tool-service-name
(e.g.NVADR-Shopping-Cart) and selectNVADRfrom the Integration Type menu. - Click the
Add Integrationbutton to save your new integration. You will be redirected
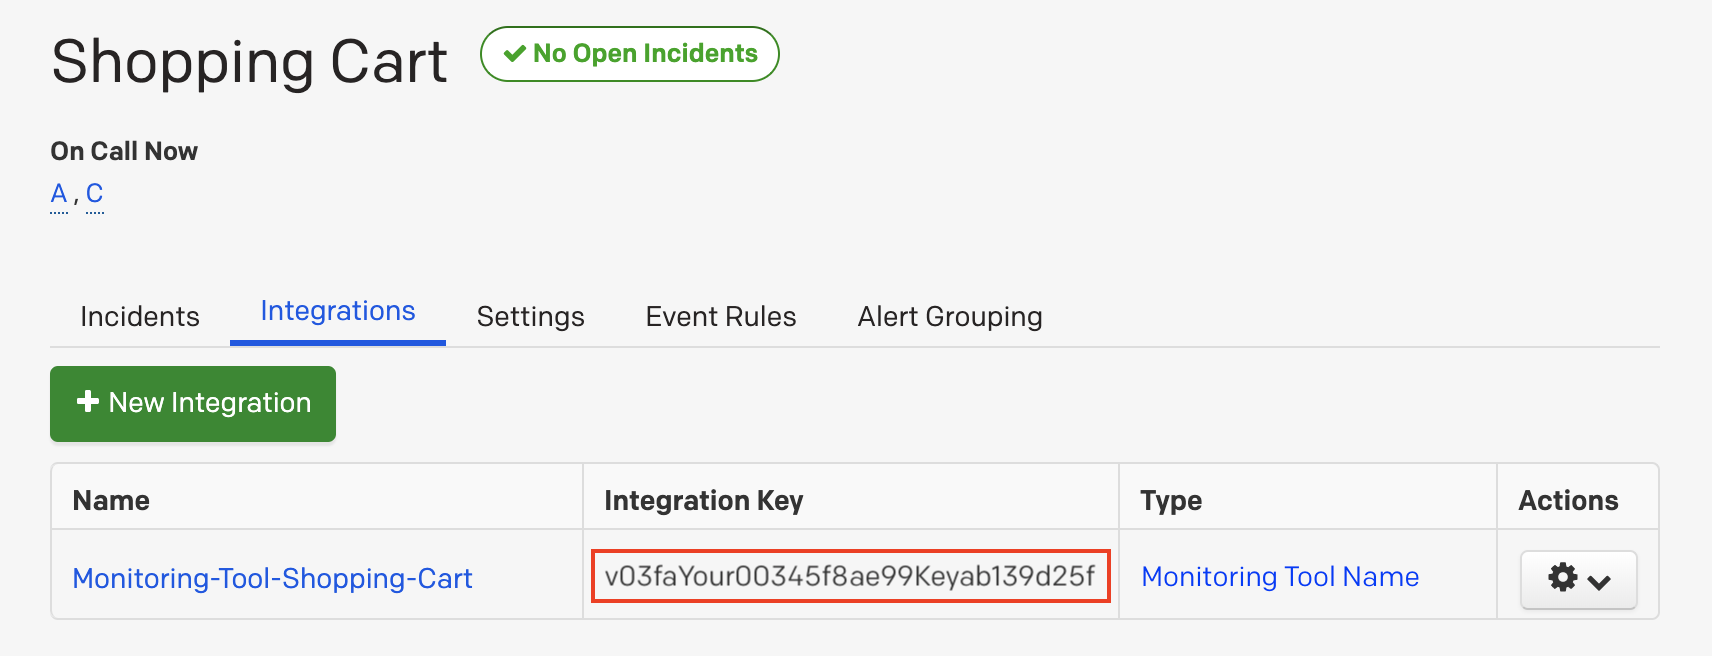
to the Integrations tab for your service. - An
Integration Keywill be generated on this screen. Keep this key saved in a safe place,
as it will be used when you configure the integration withNVADRin the next section.
In NVADR
- Login to NVADR.
- Inside
Settingstab, go to Integrations menu. - Search for
PagerDutyicon inNotificationssection and click onAdd PagerDutybutton. - On the PagerDuty Integration screen, select the Configuration tab and then click Alert with PagerDuty.
- You will be redirected to a PagerDuty authorization screen. There are two ways to authorize the integration:
- Enter your PagerDuty login information and click Authorize Integration.
- If your account uses a single sign-on provider, enter your subdomain and click Sign-In Using Your Identity Provider.
- Enter your PagerDuty login information and click Authorize Integration.
- On the next screen, you will be given multiple options that correlate with how you are integrating:
- If you are Integrating with a PagerDuty Service: select Use an integration on an existing service and select
your service from the dropdown menu. - If you are Integrating with Global Event Routing: select Create a new service with an integration
for NVADR. Enter a placeholder Service name and Escalation policy—this service and all of its settings
will be replaced by your Global Event Routing Integration key in step 7 (below). - Once you’ve made your selection, click Finish Integration.
- If you are Integrating with a PagerDuty Service: select Use an integration on an existing service and select
- You will be redirected back to the PagerDuty Integration screen in NVADR and your new integration will be authorized.
How to Uninstall
- Login to NVADR.
- Inside
Settingstab, go to Integrations menu. - Search for
PagerDutyicon inNotificationssection. - Click on the
Deleteicon infront of it to uninstall the integration.